The success of any sales initiative rests on the periodic analysis of inbound sales indicators. Without sound measurement, there is no reliable conclusion and no possible course correction.
Worse still, your company may be making the wrong decisions without noticing. And you will hardly defend a decision drawn from faulty analysis, because that decision will not deliver results.
This article makes a direct argument. You do not measure the endless list of available indicators. You choose the few that hold up the decision, and you learn to calculate each one.
What is inbound sales?
Inbound sales is selling to people who have already shown interest. Instead of approaching a stranger, the rep talks with someone who searched for information, downloaded a resource or asked to be contacted.
The buyer's pain and expectations sit at the center. HubSpot's inbound sales methodology describes the path in three phases: awareness of the problem, consideration of the options, and the decision itself.
The rep does not start from zero. Pages visited, materials downloaded and forms filled out during inbound marketing are all on record, and they show what that contact was looking for.
The difference from outbound is the starting point. Outbound creates demand by approaching people who asked for nothing; inbound captures existing demand, which even changes how a company separates a prospect from a lead.
How does inbound sales work in practice?
In practice, inbound sales is an organized handoff. Marketing delivers context, sales delivers the conversation. What decides the outcome is the quality of the information that travels with the contact.
- Attraction and capture: content answers a real question and the visitor leaves their details in exchange for something useful.
- Qualification: the team checks profile, timing and budget before passing any contact further down the line.
- Handoff with context: sales receives the history of pages, materials and interactions, not just a name and a phone number.
- Consultative approach: the first conversation starts from the buyer's problem, not from the company's catalog.
- Closing: the proposal recaps what was discussed and confirms timing, budget and who signs off.
Every stage only works when anchored in the customer's purchase journey. Pitching a closed proposal to someone still exploring the problem burns the contact and distorts how you read the funnel.
Buyers also move backward. They advance toward a decision, return to comparison and ask for more information. The process has to absorb that back and forth without pushing everyone through one script.
Why is inbound sales important for a company?
The importance of inbound sales for a company shows up first in the approach. The rep already knows what the lead searched for, what they read and where they stopped, so the conversation starts well ahead.
The second gain is cost. Talking to people who raised their hand tends to cost less than cold prospecting, because content keeps attracting contacts after publication and fewer selling hours go to waste.
The third is predictability. With defined stages and a record of what happens at each one, the cycle stops depending on one rep's talent and becomes a process the company repeats.
Anyone who wants to see the model applied to one specific sector can compare it with this look at inbound sales in educational institutions, which follows the same logic under its own constraints.
None of this holds without measurement. These gains only become evidence when the company picks the right indicators, and that is what the rest of this post covers, indicator by indicator.
Why not measure every inbound sales indicator?
The most important decision before looking at inbound sales results is refusing to analyze the endless list of existing indicators. Whoever runs the analysis must know the database and keep only what is essential.
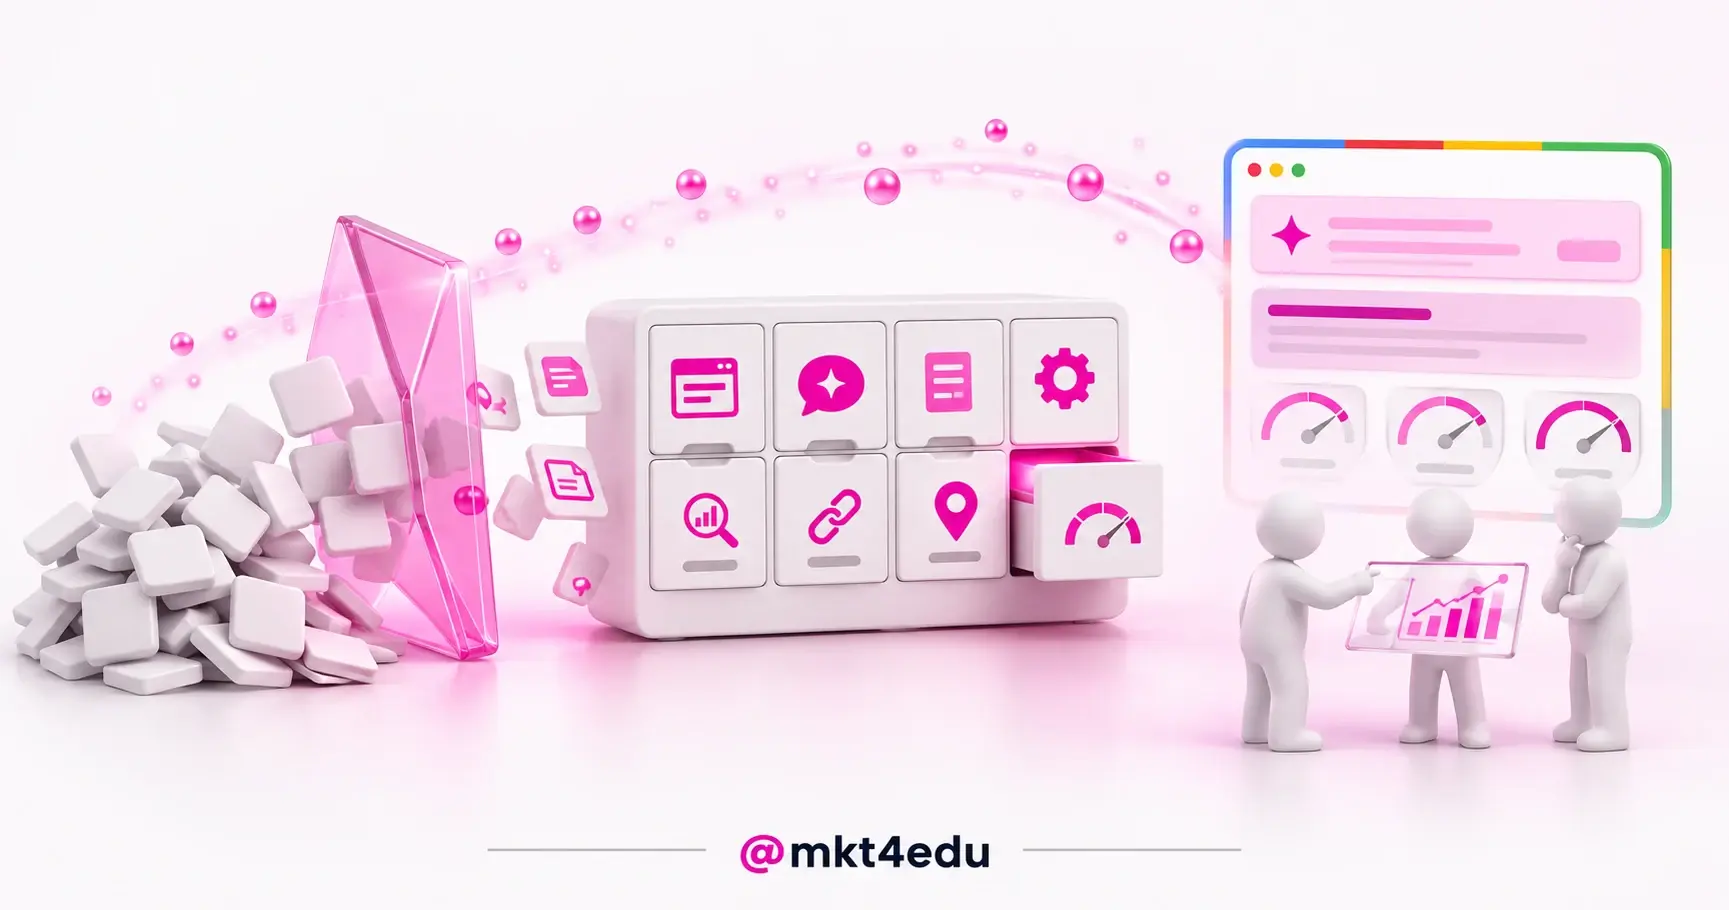
 Caption: Tracking every available indicator leads to the wrong call without anyone noticing: the work in inbound sales is isolating the few that hold up the decision.
A crowded dashboard is not rigor, it is noise. Every extra dial competes for attention with the number that truly changes the week, and the manager ends up reading the easiest one.
The cost of that is invisible. Nobody errs for lack of data: people err by reading the wrong data with confidence. The decision then collapses in the first board meeting.
Choosing indicators comes after choosing the strategy, never before. Define how marketing and sales will work together in revenue operations (RevOps), then ask which number proves the strategy works.
Another method decision: whether to separate the results of inbound marketing strategies from those driven by outbound effort. It seems obvious, but the answer changes everything that follows.
Checking how many interactions a visitor makes before converting usually shows that the efforts overlap. The sales funnel is rarely linear, and attribution rarely sits with one channel.
First contact may come from a paid media campaign on Google Ads, the name the platform adopted in 2018 in place of Google AdWords. Conversion usually arrives several visits later.
How to choose the inbound sales KPIs that hold up a decision
KPI (Key Performance Indicator) means exactly that: a key indicator of performance. The word key matters. If a number changes no decision, it is not a KPI, it is report trivia.
Three questions before adopting an indicator
- Which decision does it change: if the answer is none, the indicator leaves the dashboard.
- Who owns the number: marketing, sales or customer service has to answer for it.
- How often is it read: weekly, monthly or per sales cycle, agreed in advance.
This is where digital marketing strategies part ways with traditional advertising: they leave a measurable trail, and that trail is what turns into a defensible decision later on.
In practice, six to nine indicators are enough for a B2B company. The ones below cover the whole path: lead generation, qualification, cost, timing and customer retention.
Video: How mkt4edu reads the inbound sales indicators of a sales operation, on the mkt4edu channel (narration in Portuguese)
Choosing well depends on holding the data in one place. Without an integrated CRM (Customer Relationship Management), every team brings a different number and data analysis in the sales funnel turns into an argument.
Keep in mind that an indicator does not replace judgment. It narrows the room for guesswork and gives marketing and sales a shared language to discuss sales performance without fighting over versions.
Qualified leads and the MQL to SQL conversion
More leads, more sales? Not necessarily. Segmenting the database lets you tell apart the contacts who already see your company as the answer from those who still need time to decide.
HubSpot defines the Marketing Qualified Lead (MQL), the contact marketing has qualified as sales ready, and the Sales Qualified Lead (SQL), the one sales has qualified as a genuine potential customer.
The MQL to SQL conversion rate is the simplest formula of the set: SQLs divided by MQLs, times one hundred. It measures the quality of what marketing hands over to sales.
A low rate points to one of two places. Either the qualification criteria are loose, or the sales team is discarding good contacts because the record carries no useful context.
At a SaaS company, this shows up as the SDR (Sales Development Representative) who receives a hundred contacts and calls twenty. Review how your company defines qualified leads before blaming lead volume.
Also track the leads to close ratio, the share of leads that reach a closed deal, and the average time that path takes. Lead conversion has two axes: volume and timing.
Conversion rate: from visitor to closed customer
The conversion rate shows how many people took a given action: filling out a form, responding to a CTA (Call to Action), downloading material or completing a purchase on the website.
The formula is a division. Conversion rate = 100 x number of actions / traffic in the same period. The time window has to be identical on both sides of the equation.
Inside a B2B company, the conversion that matters most is closed deals per lead. You can break it down by rep, by product or by channel, and compare who performs best in each cut.
Heavy traffic with low conversion is a diagnosis, not a failure. It means attraction works and the opportunity is being wasted after the click, already inside your own website.
That is where pricing, offer clarity, navigation and the UX (User Experience) of the checkout or quote request page come in. For more depth, see what a conversion rate is and how it affects sales.
Poor UX on a form sinks lead conversion before any media discussion begins. Test the contact flow on a phone before you raise the campaign budget by a single dollar.
Cost per lead and CAC: what each sale costs
Cost per lead (CPL) is the entry KPI. The formula is the investment divided by the number of leads generated in the period. It applies to paid media, content and landing pages.
Before debating how to reduce cost per lead, align the team on what is cost per lead: only the spend on that action counts, within the same time window as the leads you counted.
It answers what lead generation is costing, but it does not say whether the lead becomes a customer. Learn how to calculate cost per lead step by step before comparing channels.
CAC (customer acquisition cost) closes the account. HubSpot calculates CAC as sales cost plus marketing cost, divided by the number of new customers acquired in the period.
At a consulting firm, a new customer is a signed contract. Media, salaries, commissions, tools and agency fees all count. Cheap leads with a high CAC mean the sales funnel leaks in the middle.
The relationship between the two is the real indicator. If cost per lead falls while CAC climbs, the campaign is buying poor volume, and the apparent discount ends up expensive.
Churn rate, customer lifetime value CLV and NPS
Churn rate, in HubSpot's definition, is the pace at which customers stop doing business with an organization. Customers at the start minus customers at the end, divided by the start, times one hundred.
Day to day, churn is customer cancellation. It is the indicator that says whether a closed deal became revenue or only a target met. See how to build customer loyalty with help from your CRM.
Customer lifetime value CLV, also called LTV, is the total revenue expected from one customer. HubSpot calculates CLV as customer value multiplied by the average length of the relationship.
At a subscription SaaS company, that is the monthly fee times the months under contract, plus plan upgrades and add-on services. This number tells the company how much it can pay for a customer.
NPS (Net Promoter Score) measures loyalty. Bain defines NPS through the recommendation question on a 0 to 10 scale: promoters score 9 and 10, passives 7 and 8, detractors 0 to 6.
The score is the share of promoters minus the share of detractors, ranging from minus one hundred to plus one hundred. In customer retention, it often anticipates next quarter's churn rate.
Together, the three answer what cost per lead and CAC cannot: is the customer who signed worth what they cost, and would they choose your company again given the chance?
Sales cycle: where the sales process stalls
The sales cycle is the average time between a lead's first contact and the closed deal. It is the only indicator in the set measured in days, not in currency or in percentage points.
It reveals bottlenecks in the sales process. A long cycle points to an unanswered question, a proposal stuck in approval or an overloaded rep at one specific stage of the sales funnel.
In B2B retail, the cycle varies by ticket size and by time of year. A recurring order and an annual contract do not share a clock, and inbound sales tools have to support different cadences.
Tracking the cycle lets you adjust sales strategies quickly. Shortening it almost always lifts the conversion rate without demanding a single extra dollar of media investment.
Map the customer journey stage by stage and time every handoff. The point where leads sit idle the longest is where your team should act first, ahead of any other fix.
How to build your inbound sales indicators dashboard
Taken together, the nine indicators tell a single story: attraction, qualification, cost, timing and retention. The table below sums up each formula and how to read it inside a B2B sales operation.
|
Indicator |
Formula |
What it means for the business |
|
Qualified leads |
Count by the agreed criteria |
How many contacts fit a real customer profile |
|
MQL to SQL |
SQL / MQL x 100 |
Quality of what marketing hands to sales |
|
Conversion rate |
100 x actions / traffic |
Closed deals per lead or per visitor |
|
Cost per lead |
Investment / leads |
Price of each contact generated |
|
CAC |
(Sales + marketing) / new customers |
Real cost of each new customer |
|
Sales cycle |
Average days from lead to closed deal |
Where the funnel stalls |
|
Churn rate |
(Start minus end) / start x 100 |
Customer cancellation in the period |
|
LTV |
Customer value x length of relationship |
Expected revenue from the whole customer |
|
NPS |
% of promoters minus % of detractors |
Loyalty and future cancellation risk |
Table: The nine inbound sales indicators, with each formula and its translation into the day to day of a B2B sales operation.
A dashboard only works on a single data source. Metrics scattered across separate spreadsheets hand back the original problem: every meeting opens with an argument over whose number is right.
The same dashboard lets you compare inbound marketing strategies with paid media and referrals. Without a common base, comparing sales performance across digital marketing strategies simply does not hold.
Compare the dashboard across cycles, not across weeks. Anyone who wants to revisit how to organize the reading before the numbers will find the basis in dashboards in decision making, which explains the method.
Finally, publish the dashboard. An indicator that lives on one person's computer aligns nobody: a shared indicator makes marketing and sales argue about the same reality.
Frequently asked questions about inbound sales indicators
So which inbound sales indicators should your company measure?
Without measurement, there is no way to know what your company's effort is actually returning. But measuring everything is the most elegant way to measure nothing, and to lose every argument.
Keep the nine from this article: qualified leads, MQL to SQL, conversion rate, cost per lead, CAC, sales cycle, churn, LTV and NPS. Cut whatever changes no decision.
Among them, CAC confuses the most and weighs the most on the budget. Our post on customer acquisition cost breaks down the math and shows how to lower it in acquisition: start there.















 Portugal