


Every marketing operation collects more data than it uses. The report exists, the dashboard exists, and the planning meeting still ends on the hunch of whoever speaks loudest. The problem is rarely a shortage of numbers; it is not knowing which discipline answers which question.
Business Intelligence and Data Science are neither synonyms nor competitors. One looks backward with precision, the other looks forward with probability, and a good decision usually needs both in the same cycle.
This article separates the two, shows the tools behind each and points out where they touch lead capture.
Why did data change the concept of marketing?
Data changed marketing because it replaced opinion with measurement. Campaign decisions used to come from experience and intuition; today they come from what the numbers show about who actually bought, who dropped out and who never came close.
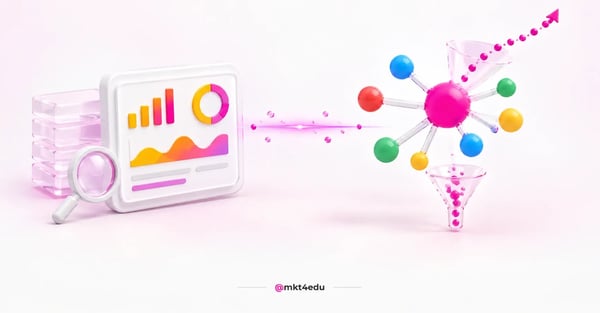 Caption: Business Intelligence and Data Science share the same data and answer different questions: what happened and what comes next.
For marketing, as for any other area, business intelligence revolves around a single point: measuring the work. Read against the available metrics, the data translates how efficient the plan actually was.
In Brazil, any use of data for marketing has to respect the LGPD (Lei Geral de Proteção de Dados), the national data protection act, which requires legitimate, specific, explicit purposes made known to the data subject and limits processing to the minimum needed to reach them.
In practice, that means mapping legal bases, recording purposes, reviewing consent and keeping audit trails along the journey. Beyond reducing regulatory risk, well governed data raises how much you can trust the analysis.
That is where this article's order comes from: understand each discipline before choosing a tool, and understand the rule before choosing the discipline.
What is Business Intelligence?
Business Intelligence, or BI, is the collection, analysis and translation of data into information management can use. Its role is to support the decision: show what happened, in what volume, through which channel and with what result, so the next choice does not rely on memory.
Used properly, BI delivers five outcomes: tracking company performance, spotting and validating market trends, identifying bottlenecks, projecting results from what has been measured and analysing customer behaviour.
Data mining and reporting
With analytics technology, you can extract information from the database and turn it into a readable report. The gain is not the report itself, it is the frequency: what used to be a quarterly exercise becomes continuous tracking.
Data warehouse and performance metrics
The data warehouse is where business intelligence organizes itself. It pulls information from specific platforms so that each element, from website to landing page, carries its own performance metric.
Descriptive and statistical analysis
Collection supports everything from counting how many users showed interest to reconstructing the path between lead capture and a closed enrollment or purchase. It is a picture of what happened, in numbers rather than impressions.
Visual analysis
Dashboards and charts make information democratic inside the team. You can tell whether the nurturing flow works, follow social media growth and translate results without noise between whoever analyses and whoever decides.
Which tools should you use for Business Intelligence?
Business Intelligence tools in marketing fall into three groups: visual dashboards, data warehouses and the native reports of platforms you already use. Starting with the third group is usually cheaper and faster than building new infrastructure.
Watch the product name, which changed twice. What was once Google Data Studio became Looker Studio and, in April 2026, Google reintroduced the Data Studio name. Reports, data sources and users were migrated with no action required from users.
In practice, the tool stays aimed at personal, ad hoc exploration, with Looker positioned as the enterprise BI platform. Teams needing organization grade features find them in the Pro edition rather than the free one.
The native CRM report is the most honest starting point for beginners. It already holds contact, source and deal data, and needs no integration. Dashboards in education marketing shows how to build that first layer without a long project.
On the measurement side, what GA4 is explains the event model feeding most acquisition dashboards. Business intelligence and big data in marketing start to make sense once those sources talk to each other.
What is Data Science and what does it calculate?
Data Science uses mathematical models for statistics and forecasting. It has three goals: collect, analyse and translate data to give the company information that used to be hard to reach and slow to interpret.
Unlike BI, which explains the past, Data Science models what may happen and what to do next. Propensity to convert and next best offer are typical examples, and both change the decision before it is made.
Target calculation
It estimates how many contacts are needed to hit the target, how long a contact takes to become a customer and the conversion between life cycle stages. The result is a realistic target built on data rather than on wishes.
Conversion calculation
It details lead conversion into customers and identifies the patterns contacts follow, which shows where investment pays off. The choice stops being the favourite channel and becomes the observed return.
Numerical reporting
It translates results for decision makers, with charts and images instead of raw tables. The goal is making the number accessible to everyone involved, not impressing with volume of information.
Logic building
It analyses how the numbers behave and links them to other variables to optimize resource use. This is where data stops describing and starts supporting reasoning about cause.
Custom dashboards
A custom dashboard filters what matters for that goal and hides the rest. Mixing data types widens the reading, as long as the cut still serves a specific question.
Which tools should you use for Data Science?
Data Science tools in marketing concentrate in three layers: the analysis language, the modelling environment and the place where the result is consumed. Python and SQL cover most cases, and consumption almost always returns to the CRM or the BI dashboard.
Python handles manipulation, statistics and predictive modelling; SQL handles extraction from the data warehouse. Neither requires expensive infrastructure to start, and both coexist with the tools the BI team already uses.
The layer most often missing is not technical. It is consumption: a model that does not return its result inside the tool where people work changes no decision at all.
That is why the fit with CRM and the customer journey matters so much. A prediction only becomes action once it reaches the record the sales team opens every day.
What is the practical difference between BI and Data Science?
The practical difference between Business Intelligence and Data Science lies in the question each one answers. BI answers what happened and why, from consolidated data. Data Science answers what is likely to happen and what to do about it, through models and probability.
Here is how that organizes:
|
Dimension |
Business Intelligence |
Data Science |
|
Question |
What happened and why? |
What will happen and what to do? |
|
Nature |
Descriptive and diagnostic |
Predictive and prescriptive |
|
Typical output |
Dashboard and report |
Model and score |
|
Who consumes it |
Management and operations |
Operations, through automation |
|
Prerequisite |
Organized data |
Organized data and history |
Table: Business Intelligence and Data Science compared by the question each one answers.
That complementarity avoids decisions in the dark and supports sharper forecasts and tests. In implementation order, BI usually comes first, because Data Science depends on the history it organizes.
One honest caveat: the border between the two is blurrier in practice than in a table. BI tools already ship predictive features, and Data Science projects deliver dashboards. What does not change is the question each one starts from.
Where does AI fit into Business Intelligence and Data Science?
AI (Artificial Intelligence) changed both disciplines on the access side, not on the mathematics. An analysis copilot lets you question the dashboard in plain language, and a data agent runs the query, builds the cut and returns the result without going through whoever writes SQL.
The practical effect is about queues. The analyst stops being the bottleneck for simple questions, which frees time for the hard one, where Data Science actually pays off.
The risk is new too and deserves saying out loud. An answer generated by an LLM (Large Language Model) over a poorly governed database comes out confident and wrong, and confidence without backing is worse than no report.
That makes the governance layer a prerequisite rather than a final step. Artificial Intelligence and the future of digital marketing details what changes in the operation once that layer is in place.
Teams that want external support in building that structure find the design in AI agents, where the data layer and the service layer meet.
How does this apply to strategic marketing?
In strategic marketing, Business Intelligence and Data Science shorten the distance between what a person needs and what the company offers. BI shows where the customer journey stalls, and Data Science estimates which offer is most likely to unblock it.
Predictive models and personalization algorithms tend to raise performance once connected to real journeys and offers. The gain shows up when message, channel and timing are orchestrated together, not when only one of them is optimized.
The practical recommendation is to start with use cases that clearly affect acquisition and customer value, and to test increments continuously instead of rebuilding everything at once.
Inbound marketing strategies gain precision here, because content gets chosen by what the data shows about the lead journey rather than by what the team imagines about it.
The same holds for inbound sales strategies: the rep receives the contact with a score and context, instead of receiving an alphabetical list.
How do BI and Data Science affect lead capture?
Business Intelligence and Data Science affect lead capture at three points: they show which channel delivers contacts that progress, estimate what each channel should cost to stay worthwhile and pinpoint where lead conversion drops inside the funnel.
When it comes to lead conversion, the number alone misleads. What decides is comparing channels over the same period and with the same definition of a qualified lead, and that is what the BI dashboard organizes.
Cost per lead comes in as the counterweight. A cheap channel that does not convert costs more than an expensive one that closes enrollments, and only the combined reading shows that.
On the conversion side, CRO is the sibling discipline. CRO in marketing works on whatever the data flagged as a bottleneck, turning diagnosis into a test.
The order that works is simple: BI points at where it hurts, CRO marketing tests the fix and Data Science estimates how much that fix should return before you invest in it.
Lead segmentation closes the loop, because it turns the identified pattern into an actionable cut inside the database.
The digital marketing strategies supporting this chain do not need rebuilding. They simply start being chosen on evidence, which changes the result without changing the team.
What legal care does data analysis require?
Data analysis in marketing requires three legal precautions: a recorded legal basis for each data type, a purpose declared before collection and a defined retention period. A predictive model built on data without a legal basis is a liability, not an asset.
Minimization is the principle that saves the most work. Collecting only what the question demands lowers risk, lowers storage cost and improves model quality, because it removes noise from the database.
Data privacy in the CRM details what the law demands from anyone centralizing customer information, which is exactly where BI and Data Science go looking for raw material.

Frequently asked questions about Business Intelligence and Data Science
Where to start with Business Intelligence and Data Science?
Start from the decision you want to make, not the tool you want to buy. Pick a question that is expensive to get wrong, find which data answers it and build the smallest possible dashboard around it. The rest of the structure grows from that first win.
After that, the natural order is organizing sources, standardizing the definitions of lead and conversion, and only then considering a predictive model. Skipping a step here costs rework, because a model over an inconsistent base returns a pretty, useless number.
Measure the baseline before any change. Without it, there is no way to separate the effect of the analysis from the effect of seasonality.
If you want to build that layer with a team that has done it in education operations, talk to us. We start by diagnosing the sources you already have before proposing any new tool.












 Portugal