


Anyone searching for what is Funnelytics usually faces a very concrete problem. The funnel exists on paper, campaigns are running, yet nobody can say with confidence where the lead disappears.
Funnelytics is a sales funnel analytics platform built for exactly that blind spot. It draws the journey on a visual map and then fills that map with real traffic, conversion, engagement and revenue data.
The drawing becomes measurement, and measurement becomes decision. That is when the funnel stops being a nice slide and starts telling you where to work first, and in which order. The discussion moves from opinion to the number attached to each stage.
Adoption, however, runs into cost, and that is the question that follows the definition most often. The platform runs on paid plans and trial periods, with no permanent free version, which changes the math for anyone assembling the stack behind their digital marketing strategies.
The bigger gain appears when the measured funnel supports a CRO routine. Every change to a page, an offer or an ad comes from a reading of customer behavior rather than from a hunch raised in a meeting.
What is Funnelytics and how does the platform work?
Funnelytics is a sales funnel analytics platform that lets you map, analyze and optimize the entire commercial process of a digital business. On a single canvas, you draw the sales funnel stages, from lead acquisition to final conversion, and follow where each person advances or drops off.
What sets the tool apart from a standard report is the format. Instead of a table of isolated metrics, you see the whole path, with volumes and drop offs drawn over the stages themselves.
That visual map makes abandonment obvious. A stage that receives a thousand visitors and delivers forty signups appears as a visible narrowing, with no manual spreadsheet work required to notice it or to explain it to someone outside the marketing team.
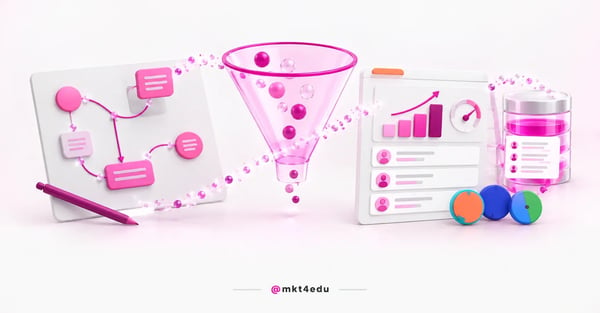 Caption: What is Funnelytics becomes clear when the drawn funnel turns into a measured funnel, with tracking and integrations reading one journey.
The platform works in two complementary layers. The first is the drawing, built by dragging and dropping pages, ads, emails and events as connected nodes, which gives the whole team the same picture of how the journey is supposed to run.
The second layer is collection. A script installed on your site records what actually happens at each node and returns the real number over the drawing, which depends on setting up that first funnel properly.
That combination is what answers the question of how Funnelytics works. The funnel stops being a drawn hypothesis and becomes a measured object, with volume, rate and loss at every passage, which is the condition for any serious optimization work.
Video: FUNNELYTICS: what it is and what it is for. AudioBlog (video in Portuguese)
What is Funnelytics for in a marketing routine?
Funnelytics is used to track and analyze customer behavior at every funnel stage, identify bottlenecks and prioritize what to fix first. In a marketing routine, that shows up on four fronts: drop off reading, campaign diagnosis, budget optimization and purchase experience.
The first front is the most immediate one. Once you can see where customers give up, the team stops debating impressions and starts debating stages, with the drop off number on the table.
The second front is campaign diagnosis. When conversion falls, the map shows whether the problem sits in the traffic source, the landing page or the offer, which shortens the hypothesis cycle considerably.
The third front is financial. By measuring the performance of each stage, it becomes simpler to identify which one delivers the best ROI (Return on Investment) and to move budget toward whatever sustains the result.
The fourth front is experience. Understanding how people interact with the brand at each stage lets you remove friction from the path, which tends to improve retention and repeat purchase over time.
These four gains only hold with recurring reading rather than a one off diagnosis. A routine of sales funnel analysis with Funnelytics keeps the map useful well after the first week.
How much does Funnelytics cost and is there a free plan?
Funnelytics Journeys has three plans on monthly billing: Map Pro at US$ 39, Performance Pro at US$ 129 and Performance Business at US$ 349. There is no permanent free plan, and free usage happens only during the trial period of each plan.
That distinction tends to create confusion in budget planning. A free trial is not a free version: it has an expiry date, and after it the subscription becomes a fixed operating cost.
Trial periods also differ from one plan to another. Here is how the three compare:
|
Plan |
Monthly price |
Free trial |
|
Map Pro |
US$ 39 |
7 days |
|
Performance Pro |
US$ 129 |
14 days |
|
Performance Business |
US$ 349 |
14 days |
Table: Funnelytics Journeys plans on monthly billing, with the free trial length of each one.
Reading the table in practice is straightforward. Map Pro covers drawing and recording the funnel, while both performance plans come into play once the priority shifts to measuring real behavior rather than documenting the flow the team believes it has.
Packages aimed at ecommerce and at service providers carry no published price. For those cases, the budget has to be confirmed directly with the company before it enters any plan.
Not every operation can absorb that investment from day one, and that is a fair constraint. Smaller teams usually get more from reading how Funnelytics works for small businesses before committing to a subscription.
How to use Funnelytics to measure the funnel you drew?
The value of Funnelytics appears when the drawn funnel becomes a measured funnel, and that shift has five concrete steps: install the tracking script, publish it through a tag manager, verify collection, define the indicators that matter and connect the attribution sources.
The first step is the script. It goes on your site and starts recording the visits and events that match the nodes drawn on the map. Publishing through GTM (Google Tag Manager) tends to be the most stable route, since a single tag container avoids code scattered across the theme.
The third step is verification, and it is the one most often skipped. Walk through your own site, fire the main events and confirm they show up in the dashboard before trusting any number.
Then comes defining the KPI (Key Performance Indicator) set for the business. Without that filter, the dashboard turns into a pile of events with no hierarchy, and nobody knows which drop deserves attention first.
The last step is attribution. Connecting traffic sources separates what came from paid media, organic search and your own base, which changes the performance reading by channel entirely and keeps two teams from claiming the same conversion.
That sequence is what answers how to use Funnelytics without hand waving. No script means no data, no verification means no trust, and no KPI means no priority, which is why skipping any of the five steps shows up later as a dashboard nobody uses.
What are the main Funnelytics functions at each funnel stage?
Funnelytics functions fall into six blocks that cover the sales funnel stages end to end: visual funnel maps, traffic analysis, conversion analysis, engagement analysis, revenue analysis and variation comparison. Each block answers a different question about the customer journey.
How do visual funnel maps work?
Visual funnel maps represent every journey stage on a single canvas, with nodes connected in the order a person travels through them. It is the function that makes the drawing shareable across marketing, sales and leadership.
With the map in place, performance tracking stops depending on interpretation. Every loss point appears exactly where it happens, which speeds up the conversation about priority and removes most of the back and forth between marketing and sales.
What does Funnelytics traffic analysis show?
Traffic analysis shows how visitors arrive at your site or landing page and how they behave at each following stage. Audience segmentation and traffic source reading help separate the channel that brings volume from the channel that brings results.
That separation is what prevents a rushed decision. A channel can lead on visits and finish last on signups, and only stage by stage reading reveals it before the budget has already been committed for the next quarter.
How does conversion analysis show where the lead drops?
Conversion analysis measures the rate of every funnel passage and exposes customer loss points. Across the customer journey stages, early and late steps fail for different reasons, and only a step by step reading shows which one is sinking the result.
That granular reading is what lets you increase lead conversion without increasing media spend. The gain comes from clearing the right stage, not from pushing more people into the top of a funnel that already loses most of them halfway.
What does engagement analysis measure across the journey?
Engagement analysis tracks events and indicators across the journey, showing which pages and actions contribute to forms, purchases and revenue. Custom indicators make that reading more objective and less dependent on generic session metrics, so you can see where interest grows and where it cools.
How does revenue analysis connect funnel and billing?
Revenue analysis ties the value generated to each funnel stage and identifies the sources that weigh most on billing. It is the block that connects marketing operation to financial results without manual spreadsheet work, which turns the budget conversation into allocation guided by return.
Can you evaluate A/B tests in Funnelytics?
You can evaluate variations in Funnelytics, even though the platform is not specifically designed for A/B testing. The route is to create two versions of the same funnel, with a single difference between them, and compare performance across the entire journey.
The advantage of that format is the scope of the comparison. Instead of looking only at the final event, you see the effect of the variation at every intermediate stage, which avoids celebrating a gain that disappears later.
How does Funnelytics support a CRO strategy?
Funnelytics supports a CRO strategy because it delivers the input most tests lack: a reading of exactly where conversion is lost. Without a measured map, teams optimize the most visible page rather than the stage that costs the most results.
In conversion rate optimization, the order of operations changes the outcome. First you measure the journey, then you raise the hypothesis, and only then you test the change, a principle that organizes any well structured CRO strategy.
Reading customer buying behavior is what separates a cosmetic tweak from a real gain. Changing the color of a button rarely moves the needle when the problem sits in the offer presented three stages earlier.
Customer journey stages ask for different metrics at each level. The top answers to reach and cost per visitor, the middle answers to qualification, and the bottom answers to proposal and objection handling.
Recognizing those stages avoids the most common diagnostic mistake. A drop at the bottom of the funnel often originates in qualification done in the middle, and the measured map makes that inheritance visible.
The same reasoning applies to inbound marketing strategies. Content that attracts a lot and converts little is not a volume problem, it is a mismatch between promise and offer, and the measured map is what tells those two diagnoses apart.
In inbound sales strategies, the map also helps the commercial team. Knowing which path the lead took changes the approach of the first conversation and reduces friction in the handoff from marketing to sales.
The practical outcome is a routine to raise the conversion rate with the Funnelytics sales funnel, with hypothesis, test and measurement living in the same place instead of scattered across three dashboards nobody opens at the same time.
In mature digital marketing strategies, conversion rate optimization becomes a calendar rather than a fire drill. The testing cycle gains a fixed cadence, and what one experiment teaches feeds the next hypothesis.
Which tools does Funnelytics integrate with?
Funnelytics has direct integrations with Facebook Ads, Google Ads, HubSpot and GoHighLevel, plus documented routes to install the base script on Shopify, GTM, WordPress and Webflow. There are also advanced setups for Calendly, ThriveCart, Vidalytics, webhook events and single page applications.
Direct integrations with media platforms are the ones that change the routine most. They let you tie ad spend to the behavior observed in the following stages, with no manual export in between.
The HubSpot connection carries its own weight for teams already running automation. Funnel data stops living in isolation and starts talking to the contact base and the relationship history, which makes the lead record usable by sales without extra work.
For anything without a native integration, there are connections available through Zapier and Funnelytics, including CheckoutJoy, Jotform, Kajabi, HubSpot, Pipedrive and ThriveCart. That route widens the reach without requiring in house development.
Which connections to switch on depends on the stack you already run. It pays to map the tools in use and align them with how to optimize the sales funnel in a marketing strategy before duplicating any data source.
One detail matters for technical planning. Sites built as single page applications need specific tag manager configuration, because moving between screens does not always trigger a new page load, and without that setup whole stages of the funnel look empty.
Video: How to integrate Funnelytics with other tools. AudioBlog (video in Portuguese)
Frequently asked questions about what Funnelytics is
Where to start with Funnelytics?
Start with the funnel you already have, even if it currently lives on a whiteboard or in a spreadsheet. Turning that flow into a visual map usually reveals duplicated stages and paths nobody uses anymore, before a single data point arrives.
The second move is choosing the plan by the objective of the quarter. If the need is to document and align the team, the mapping plan solves it. If the need is to measure behavior, the investment has to go up.
The third move is installing tracking and verifying collection before presenting any number. Wrong data shown once costs months of distrust in the tool, and rebuilding that confidence is far slower than running the check in the first place.
From there, the answer to how to increase sales conversion rate is to pick one bottleneck per cycle. Optimizing everything at once dilutes the effort and makes it impossible to know what actually worked.
If your operation needs help connecting that map to student or customer acquisition, the mkt4edu team works precisely on that seam between funnel data, content and sales, where most measurement projects stall before producing any decision.











 Portugal