



.jpg)


Many institutions have operational CRM working well and still decide in the dark. Contacts are recorded, tasks are completed, service happens inside the tool, and even so the budget meeting for the following term is still settled by impression.
That is not a platform failure, it is a maturity stage. Recording and deciding are different activities, and the second requires the first to be complete and reliable before it produces any useful reading.
The typology that separates operational, analytical and strategic CRM helps organise that evolution. It shows what the institution has already solved, what is still missing and in which order effort is worth investing.
It is worth saying where it comes from. The distinction appears in the academic literature on relationship management, such as in Iriana and Buttle's study on strategic, operational and analytical CRM, and works here as a teaching framework, not as a market standard.
What sets operational, analytical and strategic CRM apart?
The three layers differ by the question they answer. Operational CRM answers what is happening, analytical CRM answers why the result turned out that way, and strategic CRM answers what the institution should do differently in the next cycle.
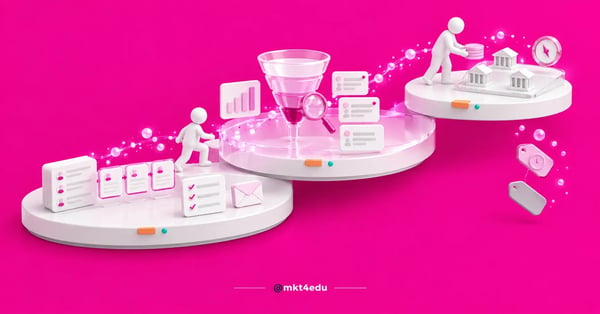 Caption: the three layers in sequence: operational CRM records, the analytical layer explains and the strategic layer decides the next cycle
The operational layer is the base of everything. It holds applicant records, the enrolment pipeline, advisor tasks, service history and communication automation with the database.
Without it, nothing above works. A report built on incomplete records produces a good-looking chart and a wrong conclusion, which is usually worse than having no report at all.
The analytical layer works with what was recorded. It cross-references source, program, campus, stage and time, and turns the history of thousands of contacts into a funnel reading.
Video: how operational CRM applies to the reality of educational institutions, on the mkt4edu channel (video in Portuguese)
The strategic layer is the least technical and the rarest. It happens when the funnel reading enters the decision to open a program, move budget, change price or revise the enrollment target per campus.
See how the three layers differ in the practice of an educational institution:
|
Layer |
Question it answers |
Who uses it at the institution |
|
Operational |
What is happening right now |
Advisors and service teams |
|
Analytical |
Why the result was what it was |
Marketing and coordination |
|
Strategic |
What to change in the next cycle |
Board and owners |
Table: distinction between the three layers of operational, analytical and strategic CRM use at a private educational institution
That distinction has practical value when it comes to investing. Institutions that buy analytical capability before organising operational records pay for reports nobody can defend in a meeting.
The separation is conceptual, not a matter of software. Anyone who already understands what a CRM applied to student recruitment is recognises the three layers inside the same platform, activated as the process matures.
Which CRM maturity stage is your institution in?
The diagnosis is simpler than it looks. Institutions in the operational stage can say how many leads came in; in the analytical stage they can say at which step those leads were lost; and in the strategic stage they use that answer to decide where to put budget and which programs to sustain in the next cycle.
A quick test settles the doubt in most cases. Ask the team what the applicant-to-enrolled conversion rate was for the worst performing program in the last admissions cycle.
If the answer requires building a spreadsheet, the institution is in the operational stage. If it comes out of the dashboard itself within minutes, the analytical layer already exists, even if it is underused.
There is a very common intermediate signal. The institution has a report, looks at the report and still decides by another criterion, which indicates distrust in data quality.
That distrust usually has a concrete cause. Blank required fields, duplicate contacts and deals sitting without updates erode the credibility of the dashboard before any discussion about strategy.
A second signal shows up in the meeting routine. When two departments arrive with different numbers for the same admissions cycle, the problem is not interpretation, it is the definition of each stage.
Standardising that definition is cheap and pays off quickly. Agreeing on what counts as an applicant, what counts as enrolled and at which moment each status changes resolves most reporting disagreements.
That is why moving up a stage starts with hygiene, not with a new tool. The analytical layer only delivers a reliable reading when operational records are complete and standardised, as the benefits of CRM in organising departments show.
What reports does an analytical CRM deliver for recruitment?
An analytical CRM delivers four readings that change the recruitment routine: conversion by funnel stage, performance by source and campaign, comparison between programs and campuses, and average time between application and enrollment. Together they show where volume is lost and how much each enrollment costs.
Conversion by stage is the most revealing. It separates an attraction problem from a closing problem, and stops the institution from buying more leads to fix a failure that sits in the service team.
Performance by source corrects budget distortion. Channels that deliver cheap leads usually look better until the reading reaches enrollment, when the efficiency ranking flips.
The comparison between programs and campuses exposes what the average hides. Two programs with the same number of applicants can have very different conversion rates, and that is the data that justifies different treatment in the next campaign.
The time between application and enrollment is the speed indicator. The longer that interval, the greater the chance the applicant enrolled somewhere else while waiting.
One complementary report usually pays off a lot and costs little. Recording the loss reason from a closed list makes it possible to separate who gave up over price, paperwork, schedule or competition.
That reading changes the conversation with the board. A price objection calls for a commercial decision, while a schedule objection calls for an academic one, and treating both with the same campaign wastes budget.
Institutions that structure those readings in a measurement plan tied to revenue operations stop rebuilding reports before every meeting and start discussing the decision itself.
It is worth adding a fifth report when the database allows it. Reading first-year student retention connects recruitment and retention in a single dashboard, instead of treating them as subjects belonging to different departments.
How does strategic CRM guide portfolio and budget?
Strategic CRM turns a funnel reading into a business decision. It guides which programs deserve investment, which need their offer revised, how to distribute budget between campuses and which enrollment target is realistic for each program in the next admissions cycle.
The portfolio decision is the most visible one. A program with high demand and low conversion points to a price, schedule or competition problem, and not necessarily to a bad program.
Budget distribution changes logic at this stage. Instead of splitting the budget by historical average, the institution invests where cost per enrollment is lower and where class capacity still allows growth.
The target also becomes calculated rather than negotiated. With the conversion rate known, the number of leads needed to hit the enrollment target stops being an estimate and becomes arithmetic.
Video: the alignment between marketing and sales that supports the move from operational CRM to strategic decisions, on the mkt4edu channel (video in Portuguese)
That arithmetic changes the tone of the budget discussion. Marketing stops asking for budget and starts presenting the cost of each additional enrollment, with a known margin of error.
At this stage, educational marketing strategies stop being a fixed annual plan. They become a set of hypotheses tested every admissions cycle, with enrollment data deciding what stays and what goes.
There is one strategic decision that almost always appears at this point. Dropout enters the conversation, because the data shows that enrolling more students without keeping them only replaces the previous term's loss.
The size of that problem is public and relevant. Instituto Semesp records annual dropout of 41.6% in distance learning and 24.8% on campus, according to the 16th Map of Higher Education in Brazil.
Given that picture, the work of controlling dropout and retaining students stops being an exclusively academic subject and becomes part of educational marketing strategies.
How do you move from one CRM stage to the next?
The evolution happens in three moves: completing the operational record, standardising the properties that feed reports and creating the reading routine where decisions get made. None of them requires changing platform, and all of them require agreement between marketing, recruitment and the board.
The first move is about discipline. Defining the mandatory minimum record per stage, and enforcing only that minimum, usually pays off more than demanding twenty fields nobody fills in.
The second move is about standardisation. Program of interest, campus, admissions cycle and source need to be closed lists, because free text destroys any later comparison.
The third move is about the calendar. Without a fixed meeting where the dashboard is read and a decision is made, the analytical layer becomes decoration and the strategic layer never arrives.
It is worth choosing a small scope to start with. One program, one campus and one admissions cycle are enough to test the full funnel reading without stopping the operation.
This kind of turn usually moves faster with outside support. Educational consultancy aimed at increasing enrollment helps define the minimum viable record and set up the first reading routine.
Teams operating on HubSpot's platform will find in the platform's feature manual an inventory of the resources that support each of the three layers. The work of HubSpot CRM for education covers the modelling that connects those resources to the enrollment funnel.
Frequently asked questions about operational CRM
What should you prioritise first to move beyond operational CRM?
Prioritise standardising the four properties that support any recruitment report: program of interest, campus, admissions cycle and lead source. Without them as closed lists, no dashboard will survive the board's first hard question.
Second, define the mandatory minimum record per funnel stage. Fewer fields filled in properly are worth more than a complete internal form the team learns to work around.
Third, schedule the reading routine. One hour a month, with the dashboard open and a decision recorded at the end, is what separates the institution that has reports from the one that uses them.
It is worth including student retention in that same routine from the start. Tracking how long enrolled students stay alongside funnel conversion avoids celebrating a cycle that is already born with dropout built in.
Only after that is it worth investing in predictive models, advanced attribution or an executive dashboard. Those layers pay off a lot when the data is reliable and pay off almost nothing when it is not.
There is a legal prerequisite in this transition. Brazil's Law 13.709/2018 requires a legal basis, a defined purpose and control over who accesses each piece of data, and those rules need to be settled before opening the analytical dashboard to new departments.
Before moving up a stage, it is worth confirming that the database supports the reading you want to make. The content on data privacy in the CRM covers the access and processing rules that need to be settled before any analytical dashboard.


























 Portugal