


Hub expansion decisions usually come from opportunity rather than analysis. A property becomes available, a partner shows interest or a competitor leaves town, and the hub opens before anyone checks whether there is enough demand there.
Geomarketing corrects that order. It puts geographic data before the decision and answers an objective question: how many people in that territory have the profile, age and income to take what the institution offers.
The question became more relevant as distance learning advanced. With more units competing for the same markets, choosing the wrong city means keeping facilities, staff and media budget in a place that will never fill a class.
What is geomarketing applied to distance learning hubs?
Geomarketing applied to distance learning hubs is the use of territorial data to decide where the institution should be present and how much it should invest in each market. It cross-references population, income, high school graduates and competing supply to estimate each city's enrollment potential.
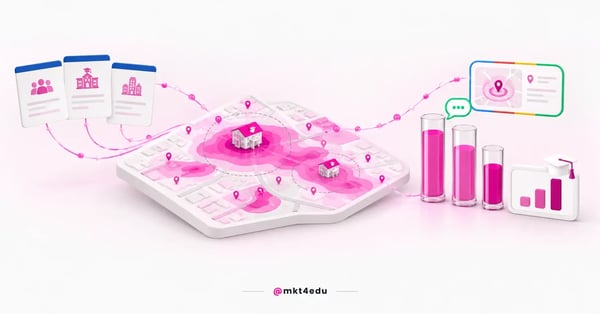 Caption: geomarketing answers where there is enough audience before the institution decides where to open and how much to invest
The difference from channel analysis is the starting point. Channel analysis asks which medium converts better, while geomarketing asks where there are enough people to convert.
Distance learning made that question central. The 16th Higher Education Map by Instituto Semesp records that distance learning reached 50.7% of enrollments in Brazil in 2024, against 49.3% for on-campus programs, the first time it has overtaken on-campus in the historical series.
That turning point changes the logic of expansion. An institution that used to grow by building campuses now grows by opening hubs, with a smaller investment per unit and far more frequent geographic decisions.
A hub has a characteristic that sets it apart from a campus. It serves a restricted territory, runs on a lean structure and depends on local volume to pay for itself, which makes a location mistake proportionally more expensive.
Geomarketing also helps decide what not to do. Identifying saturated markets prevents opening units where three competitors already fight over the same audience at low prices.
Video: the recruitment strategies that geomarketing helps aim market by market, on the mkt4edu channel (in Portuguese)
An educational consultancy usually runs this analysis before discussing any campaign. There is no point designing Educational marketing strategy for a market before knowing whether it can support the enrollment target.
Which public data shows program demand in each city?
Four public sources support a reliable initial analysis in Brazil: demographic data from the IBGE (the national statistics institute), high school enrollments by city in the Inep School Census, the Higher Education Census and the regional breakdowns of the Semesp Higher Education Map. Together, they describe potential audience and competing supply.
The IBGE Cities and States panel provides the demographic base, with population, schooling rate and GDP per capita by territory. Those numbers indicate how many people of entry age live in the market and with what ability to pay.
High school graduates are the most direct indicator of future demand. The Inep School Census breaks basic education enrollments down by city and by school. A city that graduates few classes per year has a low ceiling of entrants, no matter how much promotion it receives.
The Higher Education Census published by Inep completes the picture on the supply side. It shows how many institutions and how many programs already operate in the region before adding one more.
Here is how the sources are organized in a market analysis:
|
Source |
What it answers |
Use in the decision |
|
IBGE |
How many people and with what income |
Size the market's potential audience |
|
High school graduates |
How many enter the market each year |
Estimate the annual ceiling of entrants |
|
Inep Census |
How much supply already exists in the region |
Assess saturation and competition |
|
Semesp Map |
How the region behaves as a trend |
Contextualize growth and dropout |
|
Your own student base |
Where current students come from |
Calibrate each unit's real radius |
Table: sources that support geomarketing analysis before opening or reinforcing a hub
None of these sources decides on its own. A city with a large population and saturated supply can deliver less than a mid-sized city with no direct competitor in the intended program.
Your own base is the most underrated of the five sources. The addresses of students already enrolled reflect real travel behavior, not an estimate drawn on a map.
How do you define a hub's real catchment radius?
The real radius is found by mapping the addresses of students currently enrolled at each unit. The shape that emerges is rarely a circle: it follows roads, transit lines and natural barriers, and usually stretches further in one direction than another.
The radius drawn on a map misleads by ignoring time. Twenty kilometers on a highway with regular transport is more accessible than eight kilometers with two bus transfers.
The distribution of students also reveals the gaps. When a part of the city never appears in the base, it is worth investigating whether the problem is access, local competition or simply no promotion in that area.
Overlap between neighboring hubs shows on the same map. Two hubs competing for the same neighborhoods split enrollments instead of adding them, and the fix involves differentiating the program mix between units.
Local search is the digital translation of that radius. Local SEO (Search Engine Optimization) work ensures each unit shows up in searches made inside the territory it actually serves.
Consistency of address, phone and opening hours per unit is the cheapest fix available. It costs only attention and prevents the applicant from finding the wrong information at the exact moment of decision.
How do you prioritize hubs when splitting the local media budget?
Prioritization combines three variables per market: demand potential, historical conversion performance and local acquisition cost. Hubs with high demand and low conversion need a process fix, while hubs with high conversion and low volume usually deserve more budget than they get.
Splitting the budget equally among units is the most frequent mistake. It feels fair internally and ignores that markets have completely different potential.
Local conversion is the most revealing of the three. A unit that turns 12% of leads into enrollments can sustain a higher cost per lead than one converting 4%.
Local paid media allows fine adjustments by radius, neighborhood and time of day. Google Ads offers radius targeting and does not allow a radius smaller than 1 km around a location, which already cuts waste on an audience that would never travel to the hub.
Paid traffic is the channel that responds fastest to that geographic correction. A campaign can have its radius reduced on the same day the map shows half the clicks coming from outside the served territory.
The message changes from market to market as well. A program that sells on employability in a city with installed industry needs a different argument where that sector does not hire.
Conversational channels close the local loop. WhatsApp in distance learning campaigns lets the conversation be run by someone who knows the unit's reality, with information about the schedule and facilities at that address.
Paid media management by hub requires naming discipline. Without campaigns named by unit, the report mixes markets and blocks any budget reallocation decision.
The same discipline applies to the paid traffic budget in peak periods, which is why deciding the media budget by program in advance matters. Concentrating budget in markets with a high conversion history pays better than spreading equal investment across every unit in admission week.
Following enrollment and retention trends in the educational market helps anticipate regional moves, such as an aggressively priced competitor entering a specific market.
How do you measure geomarketing results by hub?
Measurement by hub uses four indicators: leads generated, conversion rate to enrollment, cost per enrollment and student persistence after the first semester. The first two assess recruitment, and the last two show whether the market sustains a viable operation in the medium term.
Cost per enrollment by unit replaces the overall average. The average hides loss-making hubs inside an apparently healthy aggregate result, and the reading becomes more useful next to the cost of a lost enrollment per program.
Video: the monitoring routine that supports reading geomarketing results hub by hub, on the mkt4edu channel (in Portuguese)
Persistence closes the math. A hub that enrolls well and loses half the class in the first semester costs more than it appears to, because the structure stays standing on lower revenue.
Dropout is the critical point of the modality. The 16th Higher Education Map by Instituto Semesp records a total dropout rate of 41.6% in distance learning in 2024, against 24.8% on campus, which makes recruitment and retention a single dashboard.
Dropout prediction and student retention work needs to be broken down by unit. Dropout causes vary between markets, and the corrective action should vary too.
Institutions with a measurement plan tied to revenue operations keep that tracking per hub without building a manual spreadsheet at every close.
Which geographic mistakes cost the most enrollments in expansion?
Four mistakes explain most hubs that never pay for themselves: opening because of a real estate opportunity, trusting the radius on the map, ignoring local competition and treating every market with the same campaign. All are avoidable with analysis done before the contract is signed.
The real estate opportunity misleads precisely because it looks rational. Cheap rent lowers fixed costs, but it does not create demand where there is none.
The radius on the map produces an unrealistic expectation of reach. It tends to overestimate the territory served and inflate the enrollment projection used to approve the opening.
Local competition is frequently underestimated in the projection. Entering a market where two competitors already operate at low prices requires a clear differentiator, not just presence.
A single campaign for every unit wastes budget at both ends. It overinvests where there is no audience and underinvests where there was room to grow.
There is a fifth, less visible mistake that appears after the opening. The institution builds the structure and only then thinks about local promotion, losing the entire recruitment cycle that would have justified the investment.
Planning communications alongside construction avoids that gap. A published unit page, a complete local listing and a campaign ready before the opening take advantage of the first admissions cycle.
Frequently asked questions about geomarketing
What changes in recruitment when geomarketing guides expansion?
The nature of the budget conversation changes. With geomarketing, the institution stops discussing how much to invest in total and starts discussing how much to invest in each market, based on estimated potential, historical conversion and each unit's known cost per enrollment.
The pace of expansion changes too. Hubs chosen with data open with a realistic projection, a local campaign ready and a target matched to the size of the territory, instead of depending on a surprising first semester.
The effect shows up in student retention. When the market supports the program and the communication describes the routine accurately, the incoming class has fewer reasons to drop out midway.
With that, geographic analysis stops being an expansion exercise and starts supporting recruitment and retention in the same move. Choosing the market well is the first retention decision the institution makes.
Once the market is defined, what happens on the street still has to connect to what happens online. The content about hybrid marketing with HubSpot shows how to tie in-person action and online channels into the same reading of results.













 Portugal