Digital marketing has become less intuitive and far more dependent on journey analysis. Teams that decide from isolated campaign metrics see fragments of the path, and almost never the full route from first visit to closed deal.
Funnelytics answers that problem by drawing the funnel as a map, with people moving across pages, ads and content. Analysis stops being a pile of reports and becomes a story with a beginning, a stall and an outcome.
This article covers the investment landscape, how the platform works, the stages of the sales funnel, the CRO strategy that grows out of the map and the limits no tool solves on its own.
What is Funnelytics and why does it matter in digital marketing?
Funnelytics is a visual funnel mapping and customer journey analytics platform. It lets teams draw, track and measure every funnel stage on a single canvas, showing the real flow of people moving through pages, campaigns and brand content.
The difference from a traditional report sits in the unit of analysis. A report returns the rate of one isolated page, while the map returns the path that brought someone there and what happened next.
That shifts the internal conversation. Instead of arguing about which ad got more clicks, the team discusses which combination of ad, page and content produces a real sales opportunity.
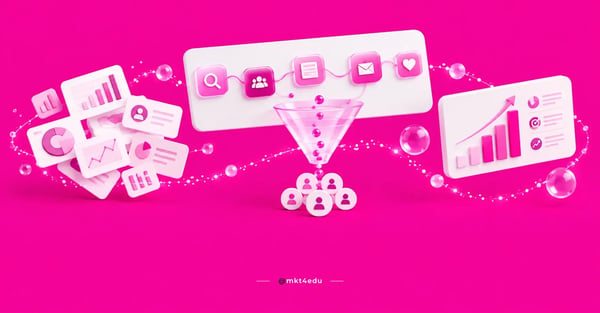 Caption: The visual funnel map links campaign, page and conversion into a single digital marketing reading.
The gain does not come from the technology itself, it comes from less friction between data and decision. Once the bottleneck is drawn, the team stops negotiating interpretations and starts choosing the next test.
Video: how to use Funnelytics in practice, from the first map to reading the whole funnel. Narrated in Brazilian Portuguese, with automatic captions available.
The walkthrough above shows the platform in use. The narration is in Portuguese, so turn on automatic captions if you prefer to follow it in English.
How much does the world spend on advertising and why does that squeeze the funnel?
Global advertising investment is set to reach US$ 1.06 trillion in 2026, in a dentsu forecast, growing 5.0% over 2025. The market expands and, in the same movement, gets more crowded in every media channel.
Digital dominates that total. The same forecast puts digital at 69% of global advertising investment in 2026, concentrating most of the budget in channels that record clicks, visits and conversions.
More money in measurable channels means more competition for attention and less tolerance for trial and error. Acquisition cost rises when every advertiser bids for the same space in the same auction.
This is where journey analysis stops being a refinement and becomes cost control. Knowing which stage burns the investment is worth more than knowing the total click volume of the month.
The marketing strategies that survive this squeeze share one trait: they can answer where the money enters, where it travels and at which point it stops paying off.
How does Funnelytics turn data analysis into a competitive advantage?
Funnelytics converts scattered data into a visual journey flow, and that translation is what creates advantage. The team stops decoding tables and starts watching where people disappear, which shortens the gap between spotting a problem and testing a fix.
Three shifts show up in the first weeks of use:
- Real path instead of isolated rate: the team sees the sequence of pages, not only the conversion rate of each one.
- Campaigns and automations on one canvas: ads, landing pages, emails and nurture flows sit in a single drawing.
- Bottlenecks identified by behavior: the drop shows up tied to consumer behavior, not to impressions or clicks.
None of this is a technological miracle. It is visualization plus context, which makes certain decisions obvious and removes most of the opinion-driven debate from the room.
The reading gets sharper when the team understands the factors that influence consumer behavior before interpreting a drop. Not every exit is a page problem, part of it is an offer or a timing problem.
How do you map the buying journey and the customer journey in the funnel?
Mapping the buying journey means recording the stages a person goes through between first brand contact and decision, with every touchpoint named and connected. The map shows how many people enter each stage and how many move on to the next.
The drawing usually starts with what already exists. Listing entry pages, live forms and running campaigns tends to expose a funnel far messier than the internal deck suggests.
A working routine helps you leave the whiteboard. The practices for mapping the customer buying journey cover data collection, stage definition and the choice of events that mark progression.
From the lead journey to the CRM record
The lead journey starts before the form and continues after it. The visual map covers the anonymous part of the path, and the CRM (Customer Relationship Management) takes over once the contact has a name, an email and an owner.
Both readings have to talk to each other. The customer journey analysis inside the CRM shows what happened after conversion, including proposal, negotiation and loss, which the funnel map alone cannot see.
Content enters this drawing as a node, not as a deliverable. In an inbound marketing operation, the article, the ebook and the webinar occupy specific positions in the lead journey and can be measured by progression, not only by traffic.
Seeing which assets appear most often in paths that become opportunities solves a familiar frustration: producing volume without being able to prove any impact on the buying journey.
What are the stages of the sales funnel and how do you analyze each one?
The digital sales funnel usually breaks into four stages: top, middle, bottom and retention. Each one calls for its own metrics and answers different questions, and mixing those indicators is the mistake that most distorts result reading.
Here is how that organizes:
|
Funnel stage |
Core metrics |
Question the map answers |
|
Top (discovery) |
Impressions, visits, time on page |
Which sources bring visitors who move to the next stage? |
|
Middle (consideration) |
CTA clicks, downloads, sign-ups |
Which content appears in the paths that create qualified leads? |
|
Bottom (decision) |
Proposal rate, closed deals |
At which point do people disappear before buying? |
|
Retention |
Renewal, expansion, churn |
Which journeys sustain the customer experience after the sale? |
Table: Sales funnel stages, the metrics of each one and the question journey analysis answers.
The table exposes a common imbalance. Many operations measure the top with rigor, the bottom with estimates and retention almost never, which pushes budget talks toward the easiest metric to collect.
It pays to watch the link between conversion rate and the Funnelytics sales funnel stage by stage. A two-point gain in the middle often produces more revenue than a large traffic increase at the top.
How do you build a CRO strategy from the visual funnel?
A CRO strategy starts with choosing the bottleneck, not with choosing the test. The funnel map hands over the stage with the largest absolute loss, and that is where an experiment can move revenue instead of moving a single page metric.
The sequence that tends to work has four moves:
- Find the biggest absolute drop, in number of people rather than percentage, so you avoid optimizing a low-volume stage.
- Build hypotheses with qualitative data, using session recordings, customer research and conversations with the sales team.
- Test one variable at a time, with enough volume for the observed difference to sit outside the noise.
- Record the learning on the map, because the outcome of one test changes the priority of the next cycle.
What the market calls CRO marketing is exactly this routine: short cycles of hypothesis, test and reading, anchored in a complete view of the funnel. Without the map, the program becomes a queue of guesses about button color.
Entry pages hold most of the early gains. Working on landing pages for lead conversion usually delivers results before any structural change to the offer.
A mature CRO marketing program also knows when to stop. Once the marginal gain falls below the cost of running the test, priority moves back to acquisition, positioning or product.
Lead conversion improves faster when the conversion rate is read by traffic source. The same form often performs very differently for people arriving from search and from paid media.
How much does Funnelytics cost and what changed in its pricing model?
Funnelytics replaced the permanent free plan with a trial model that opens broader access to analytics features. The evaluation runs for 7 or 14 days depending on the plan, and continued use requires a subscription.
The current tiers separate teams that only draw funnels from teams that also measure flow:
|
Plan |
Monthly price |
Who it fits |
|
Map Pro |
US$ 39 |
Teams that need to draw and share the funnel map |
|
Performance Pro |
US$ 129 |
Teams measuring flow and conversion inside the map |
|
Performance Business |
US$ 349 |
Operations with several funnels, clients or business units |
Table: Funnelytics plans and the kind of operation each price tier serves.
The figures sit in the official pricing page of the platform, which also details tracking volume and user limits per tier.
Ending free access changed the adoption math. The tool now has to prove value inside the trial window, which rewards teams that arrive with one priority funnel already defined.
The numbers add up when the map influences budget decisions. Teams that measure return on investment with Funnelytics can compare the subscription cost against stage-level gains instead of treating the tool as fixed overhead.
How do agencies and in-house teams scale results with the visual funnel?
For an agency, the funnel map works as an alignment instrument, not only as an operational tool. It shows visually what has been built, where the bottleneck sits and what comes next, which shortens meetings and reduces expectation noise.
Four uses show up often in teams already running this model:
- The map in results meetings: strategy gets explained on one screen, without depending on spreadsheet interpretation.
- A dashboard per client: every account has its own funnel, with readings comparable across projects.
- A playbook of recurring bottlenecks: patterns repeating across accounts turn into reusable fixes.
- Visual case studies: the before and after of a funnel supports the commercial conversation with data, not adjectives.
The effect on the client base is direct. Funnel reading applied to customer retention with Funnelytics anticipates signs of wear that a monthly report only reveals once the contract is already at risk.
The same map brings marketing and sales closer. In an inbound sales operation, a rep who sees the path the lead walked opens the call already knowing what the person read, downloaded and compared.
That alignment settles an old dispute. The inbound marketing team stops delivering volume without context, and the inbound sales team stops discarding leads without explaining why.
Strong marketing strategies grow out of this shared definition of progression. Without a common idea of what a stage means, each area measures something different and the meeting turns into a negotiation over numbers.
What is the role of AI and LLMs in customer journey analysis?
AI (Artificial Intelligence) entered journey analysis through clustering and automated reading. Analytics and attribution platforms already group similar journeys, describe patterns in plain language and suggest where a test is most likely to pay off.
Four movements are visible in the tooling market:
- Automatic clustering of journeys with similar behavior.
- Plain-language summaries of what changed between two periods.
- Links between funnel data and real-time content personalization.
- Scenario simulation to support budget decisions.
The limit of these capabilities is well known. An LLM (Large Language Model) describes what happened and proposes hypotheses, yet it does not know which one matters to the business, because it has no view of product margin or delivery capacity.
The decision stays human. The model speeds up reading, and priority still depends on commercial context, operational constraints and conversations with customers.
Journey data becomes far more useful when it meets the commercial record. The link between CRM and digital marketing is what connects the anonymous visitor path to the outcome logged in the deal.
What are the risks and limits of visual funnel analysis?
Visual funnel analysis has technical and cultural limits. It depends on correct tracking, maintained integrations and a learning curve that tends to intimidate small teams during the first month of use.
Four traps show up often:
- Optimization as a comfort zone: the team polishes the current funnel and stops testing new approaches.
- Small gains celebrated too loudly: two points of conversion rate do not offset a worse customer experience.
- Data without qualitative context: the number shows the drop, the interview shows the reason.
- Dependence on a single tool stack: the operation becomes hostage to an integration that can change without notice.
There is also a less technical risk. Maps and dashboards can become a shield against hard decisions, such as revising an offer, repositioning the brand or shutting down a channel that no longer makes sense.
Naming these limits does not diminish the map. It sets realistic expectations and keeps the customer experience as a decision criterion, next to the rate that went up on the dashboard.
What practical steps put Funnelytics into the operation?
Rollout works better in slices. Starting with one priority funnel tied to a core offer produces visible results in a few weeks and avoids the exhaustion of trying to map the whole operation at once.
Seven steps cover the first cycle:
- Pick one priority funnel, tied to an offer that already has volume and commercial weight.
- Draw the current funnel, even without every integration in place, to expose the real path.
- Connect traffic sources and pages, checking whether tracking records what it should record.
- Define progression and conversion events, separating real progress from simple interaction.
- Watch it for a few weeks, long enough for volume to allow a reliable reading.
- Plan tests on one or two stages, instead of changing everything and losing cause and effect.
- Turn the pilot into a template, replicating the structure that worked across the remaining funnels.
Tracking quality defines map quality. It is worth checking how to integrate Funnelytics with Google Analytics before drawing conclusions from any drop, because most anomalies come from incomplete tagging.
By the end of the pilot you will have something more useful than theory: a concrete case of a decision made from the map, which makes the budget conversation with leadership or clients far easier.
Frequently asked questions about digital marketing and Funnelytics
What changes in digital marketing when you see the whole funnel?
The criterion for priority changes. Teams that see the whole funnel stop picking the next action by what is easiest to execute and start picking it by the point where most people give up.
The budget conversation changes too. With the path drawn, a funding request stops being a defense of a channel and becomes an argument about the stage that blocks revenue.
The role of content changes as well. The article, the ebook and the video stop being loose deliverables and take a measured position inside the lead journey.
The first step is not buying a tool, it is drawing your current funnel honestly. A good tool accelerates a reading that already started, it does not create one from scratch.
Teams that want support structuring that reading can talk to the Mkt4edu team and start from a diagnosis of the current funnel.













 Portugal