






Annual dropout in Brazilian distance learning reached 41.6% and in-person learning came in at 24.8% in 2024, according to the 16th Higher Education Map by Instituto Semesp. Those numbers put persistence on the same priority level as recruitment.
Retaining students, though, is still treated as the academic team's business, while student recruitment belongs to marketing. That separation explains much of the problem.
Among educational marketing strategies, persistence is the one that usually receives the least budget and the least technology, even though it protects revenue already won.
When attendance, finance and service data live in systems that do not talk to each other, nobody sees the whole student. And the risk warning only arrives when re-enrollment does not happen.
What does student retention look like in practice?
Student retention means keeping the student enrolled and active through to graduation, acting on the reasons that would make them leave. In practice, that means detecting risk early, responding fast and logging every interaction, so the institution sees patterns instead of isolated cases.
Retention in higher education rarely fails for a single reason. It fails by accumulation: a financial difficulty on top of an unanswered question on top of a semester with low grades.
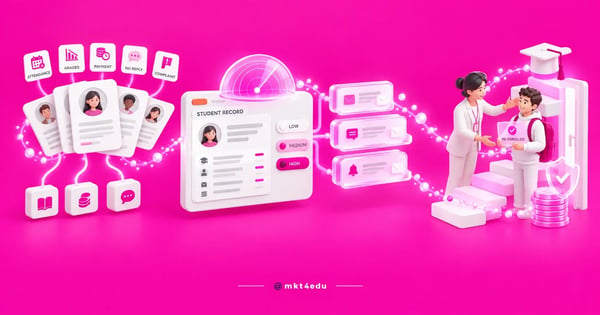 Caption: student retention starts by seeing the risk signals early and firing the right message for each level
Each of those points has a different owner inside the institution. Finance sees the late payment, the coordinator sees the grade, support sees the complaint, and nobody sees all three together.
It is precisely that combined view that changes the outcome. The variables that drive dropout and school abandonment almost always appear before the formal withdrawal, in records the institution already holds.
It is worth acknowledging that the cause is rarely single. A review published in Revista de Gestão e Secretariado concludes that the causes of dropout in higher education are multivariable, with financial, academic and psychological or individual factors prevailing.
Treating different causes with the same approach wastes effort. The student who has not adapted yet needs guidance and reassurance, and the student in financial difficulty needs a concrete payment alternative.
Which signals show dropout risk before the student leaves?
mkt4edu monitors five signals: falling attendance, declining grades, late payment, no response across communication channels and a logged complaint with no resolution. They translate into records the financial, academic and individual factors that the dropout literature identifies as prevailing.
Combined, those signals let you sort students into risk levels and prioritize contact. No single signal is conclusive, because a late payment can be forgetfulness and an absence can be a one-off.
The reading changes when two or three signals appear for the same student in a short window. That combination usually precedes the decision to leave by weeks, which is enough time to step in.
Sorting by level helps calibrate the effort. Here is how the signals organize into priority bands:
|
Risk level |
Combined signals |
Recommended action |
|
Low |
One isolated, recent signal |
Automated supportive communication |
|
Medium |
Two signals in the same month |
Personalized message and an offer of help |
|
High |
Three signals or a request to suspend studies |
Human contact with authority to resolve |
Table: A model for classifying dropout risk from signals the institution already records.
This classification does not need artificial intelligence to get started. A simple rule, revisited each semester, already delivers a meaningful gain over having no criteria at all.
How does the HubSpot CRM organize student relationship management?
The HubSpot CRM organizes student relationship management by bringing contact history, lifecycle stage and the properties that flag risk into a single record. With that, attendance, payment and support stop being separate screens and become one view.
The starting point is modeling the student lifecycle inside the CRM. Prospect, applicant, enrolled, active student, at-risk student and alumnus are different stages, with different communication and different owners.
Without that modeling, the institution uses a CRM designed for sales on a process that is not a sale. The result is a funnel that ends at enrollment and does not follow what comes after.
Video: a re-enrollment and student retention automation case presented on the mkt4edu channel (in Portuguese)
With the lifecycle defined, risk properties come in as fields of their own. Risk level, date of last contact and stated reason for dissatisfaction become filterable, rather than loose remarks in a free-text note.
The gain shows in daily operations. A CRM applied to recruitment and persistence lets coordinators and support staff see the same history, without asking the student to repeat their own story on every channel.
There is a mandatory precaution in this design. Academic performance and financial status do not fall under the list of sensitive personal data in article 5, II of Brazil's LGPD, but they do require a defined legal basis and access control, the subject of privacy handling inside the CRM.
The list in the law is closed: racial or ethnic origin, religious belief, political opinion, membership of a union or of a religious, philosophical or political organization, data concerning health or sex life, and genetic or biometric data.
How do you build educational communication automation for retention?
Educational communication automation for retention works in three layers: preventive messages for every student, messages triggered by a risk signal, and internal alerts for the team. Each layer has its own trigger, and none of them replaces human contact in serious cases.
The preventive layer is the cheapest and the most forgotten. It includes welcome messages, first-weeks guidance, deadline reminders and recognition of progress, and it reduces the early dropout tied to adaptation.
It is also the layer that borrows most from the educational marketing strategies already in use. Content, segmentation and cadence change purpose: they move away from conversion and start serving persistence.
The risk-triggered layer kicks in when CRM properties change. A student who moves to medium risk gets a different message from the general communication, with a supportive tone and a clear path to respond.
Here it pays to reuse what already works in recruitment. The logic of a well-built communication sequence applies just the same to persistence, changing the content and keeping the cadence structure.
The third layer is internal. When a student reaches high risk, the person who needs to be notified is the coordinator, not the student, because the next step there is a conversation and not another automated message.
Institutions already using artificial intelligence in retention support manage to extend the coverage of those layers without growing the team at the same rate.
In practice, that coverage comes from voice and support AI agents combined with the email marketing and nurture operation that sustains the preventive layer.
When does automation stop and human support take over?
Automation stops when the student replies, when risk reaches the high level, or when the reason involves money, health or conflict. From there, contact has to be human and come from someone with the autonomy to offer a solution, not just to log the problem.
The most common mistake is leaving the automated sequence running after the student has replied. Receiving a generic message right after explaining a difficult situation turns a retention effort into one more reason for frustration.
The technical rule is simple: a reply from the student ends the automation and opens a task for a person. Without that cut-off, the institution scales noise instead of scaling care.
It is also worth defining who makes that contact. Program coordinators usually have more effect than a call center, because they know the academic context and can negotiate deadlines, make-up work or a change of course.
The deadline for that contact is part of the rule. A high-risk task opened on Monday and handled on Friday loses its effect, because the decision to leave usually matures within days.
Recording the outcome closes the loop. Knowing whether the student stayed, paused or left, and why, is what lets you adjust the sequence next semester instead of repeating the same design.
How do you integrate academic and financial data into the HubSpot CRM?
Integrating academic and financial data into the HubSpot CRM does not require migrating systems. It is enough to sync the fields that indicate risk, such as attendance, financial status and enrollment status, keeping the academic system as the system of record and the CRM as the relationship layer.
That scoping avoids the never-ending project. The temptation to integrate everything usually stalls the initiative for months, while dropout keeps happening at the same pace.
Start with three fields. Financial status, attendance percentage and academic status are already enough to build the risk classification described above.
Sync frequency matters more than the number of fields. Data refreshed once a month arrives too late for a student who has been missing for three straight weeks.
Defining the source of truth for each piece of information avoids conflict later. Grades and attendance belong to the academic system, payment status belongs to finance, and conversation history belongs to the CRM.
How do you measure dropout reduction and revenue preserved?
Dropout reduction is measured by comparing persistence across similar cohorts before and after the program, and converting the difference into revenue preserved. The math uses the number of extra students retained multiplied by average tuition and by the time remaining in the program.
That number is what sustains a budget in a board meeting. Talking about “engaged students” impresses far less than tuition payments that kept arriving.
Three indicators organize the tracking: persistence rate by period, average time between the first risk signal and the first contact, and recovery rate among students contacted.
The second indicator is the most actionable of the three. It measures the speed of the operation, and it is where most institutions discover their own bottleneck.
It is worth tracking student recruitment and retention on the same dashboard. When both numbers sit side by side, it becomes visible that cutting dropout by a few percentage points can be worth more than raising the media budget next semester.
The comparison gets more honest when the institution uses its own student recruitment cost as the reference. Putting the cost of the retention program next to the cost of a new enrollment shows which of the two fronts pays off more this semester.
The comparison also guides prioritization by program. Programs with high dropout and high recruitment cost are the ones that return the most when they get attention first.
Educational consulting usually starts right there, because persistence data reveals whether the problem sits in the promise made during recruitment or in the experience of the program itself.
Common questions about student retention
What does an institution lose by postponing student retention?
Postponing retention costs twice. You lose the tuition revenue that student would still pay, and you also lose the recruitment investment already spent to bring them in, which does not come back.
With annual dropout at 41.6% in distance learning and 24.8% in-person in 2024, according to the 16th Higher Education Map by Instituto Semesp, every semester without a structured program repeats the same math. The institution rebuys, at media prices, the seat it had already filled.
The start does not have to be big. Three synced fields, a three-layer sequence and one response-time indicator already put the operation ahead of anyone who only discovers the dropout at re-enrollment.
An automated sequence solves the fast response, but it does not replace a persistence plan. The article on what to do to control dropout covers the academic and support actions that back up what the system detects.

























 Portugal