


Customer acquisition cost is one of those metrics everyone quotes and every department calculates differently. In the same budget meeting, a single result shows up as three distinct numbers, because each team added different items.
The divergence is rarely in the formula, which is simple. It is in what each one decided to include: one team counts only paid media, another adds salaries, a third mixes retention costs into the acquisition figure.
This guide organises that calculation. You will see what CAC is, what belongs in it and what does not, how to calculate it step by step and how to adapt the metric to student recruitment, a context where programme and study mode change the number completely.
What is customer acquisition cost (CAC)?
CAC is the metric that shows how much the company invests, across marketing and sales, to win each new customer. The definition of customer acquisition cost popularised by HubSpot gathers every acquisition cost of the period, from ads to salaries, divided by the total customers closed in the same window.
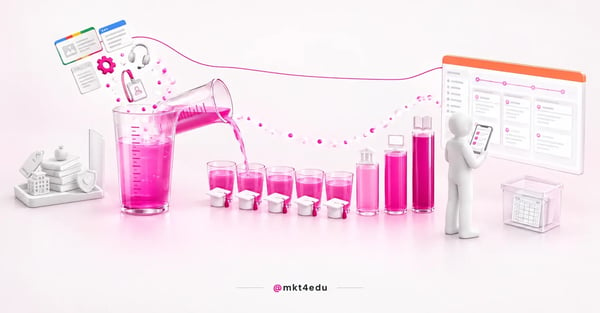 Caption: customer acquisition cost is the period's investment divided across the enrolments it produced
The number answers a question no other metric covers on its own: is the growth paying for itself? An operation can hit its lead and enrolment targets every month and still spend more on each customer than that customer returns in revenue.
So CAC is never read in isolation. It gains meaning next to average ticket and LTV: the relationship between what is spent to win and what comes back afterwards decides whether the model works.
Video: audiobook from the mkt4edu channel on the funnel that separates cost per lead from customer acquisition cost
It is also worth separating CAC from a neighbouring metric it gets confused with constantly. Cost per lead measures the price of generating an interested contact, while CAC measures the price of turning contacts into closed customers.
That difference changes decisions. A channel can deliver the cheapest cost per lead in the operation and, at the same time, the most expensive CAC, because the contacts it generates convert poorly through to enrolment or contract.
What belongs in the CAC figure and what does not?
Every cost whose job is to generate and convert demand belongs in the figure: paid media, salaries and commissions for the marketing and sales teams, tools, agencies, content production and recruitment events. Out go the costs of running the service, general administrative expenses and everything that happens after the sale.
The test that settles almost every doubt is simple: would this cost exist if the company stopped looking for new customers? If the answer is yes, it belongs to operations, not to acquisition.
Here is how the most common items sort out under that test:
|
Item |
In the figure? |
Why |
|
Paid media (Google, Meta and portals) |
In |
It is the most direct cost of acquisition campaigns. |
|
Marketing and sales salaries and commissions |
In |
Without the team there is no campaign and no close; apportion by time spent on acquisition. |
|
Marketing, automation and lead management tools |
In |
They are the infrastructure used to generate and convert demand. |
|
Agencies, consultancies and freelancers |
In |
It is outsourced acquisition cost, even off payroll. |
|
Content production, SEO and the website |
In |
The organic channel has no media cost, but it does have a production cost. |
|
Events, fairs and school visits |
In |
They are direct recruitment and demand generation actions. |
|
Discounts and scholarships |
Out |
They reduce revenue per customer; they affect average ticket, not acquisition cost. |
|
Teaching payroll and academic operations |
Out |
It is the cost of delivering the service, not of winning the customer. |
|
General administrative expenses |
Out |
They would exist even with no acquisition effort at all. |
|
Retention and customer success actions |
Out |
They belong to retention cost and to the LTV figure. |
Table: composition of customer acquisition cost item by item, with the test that defines each inclusion
Two items on the list deserve extra attention. Salaries go in proportionally: if the same team splits its time between acquisition and retention, only the acquisition share belongs to CAC.
Organic content is the other sensitive point. It looks free because there is no media spend, but writers, designers and optimisation hours cost money, and that production has to go into the figure alongside paid campaigns.
The choice between the two paths changes how CAC behaves over time: paid media generates immediate volume at a recurring cost, and organic takes longer but dilutes the cost with every month the content keeps attracting leads.
It is the pattern of inbound marketing: the investment concentrates in production, and cost per customer falls as the content accumulates traffic and conversions.
Video: conversation from the mkt4edu channel on the two fronts that weigh most on customer acquisition cost
How do you calculate CAC step by step?
Define a period, add up all the marketing and sales investment made in it and divide by the number of new customers won in the same window. The CAC formula is marketing investment plus sales investment, divided by the number of new customers in the period.
The formula fits in one line, but each of its terms hides a decision. There are five, settled one at a time:
- Define the period. use the month or the quarter and keep the same cut every time; long sales cycles call for wider windows, such as the recruitment term.
- Add up marketing costs. include media, tools, content production, agency and the proportional share of team salaries.
- Add up sales costs. include salaries, commissions, telephony and the share of sales tools used to close new customers.
- Count only new customers. renewals, re-enrolments and contract upgrades stay out of the denominator.
- Divide, then segment. calculate overall CAC and repeat the sum by channel, by product or by programme to see where the cost concentrates.
A worked example with round numbers helps it stick. An institution invested R$ 60,000 in marketing and R$ 30,000 in sales over the quarter and closed 60 new enrolments: CAC is R$ 90,000 divided by 60, or R$ 1,500 per student.
Step 5 is what separates a decorative metric from a useful one. An overall CAC of R$ 1,500 can hide a channel that wins students for R$ 600 and another that costs R$ 4,000 per enrolment, and only the segmented view shows where to reallocate the marketing budget.
To segment, each customer's source has to be recorded from the first click to the contract. This is where funnel data quality becomes a prerequisite of the metric, before any discussion about channels.
In digital marketing strategies, that tracking starts in the campaign parameters and has to survive all the way to the contract, without getting lost in a change of form or system.
On the sales side, the investment only justifies itself when the team converts what it receives. That is why performance indicators in Inbound Sales belong in the same reading as CAC: acceptance rate, first response time and conversion by stage explain why a channel that looks expensive on paper can come out cheap per enrolment.
CAC in education: how do you calculate acquisition cost by programme and study mode?
In education, CAC becomes student acquisition cost, and the overall average hides what matters: the cost of recruiting for a high-ticket on-campus degree does not compare to that of an online postgraduate course. Calculating by programme and study mode turns the metric into a portfolio decision.
Splitting by study mode has stopped being a statistical refinement. The 2024 Higher Education Census, run by Inep, Brazil's national education statistics institute, recorded distance learning at 50.7% of enrolments and 66.8% of new entrants in Brazilian higher education.
Persistence completes the picture. The 16th Higher Education Map by Semesp, the association representing private providers, records a 2024 dropout rate of 41.6% in distance learning and 24.8% on campus.
Together, the two figures change how the cost reads. A low acquisition cost in distance learning can turn out expensive: with dropout almost twice as high, the student has fewer months of fees to pay back the investment made to win them.
That crossover changes the education marketing strategy: a programme with low CAC and high dropout can destroy the margin, while a more expensive CAC pays for itself when the student stays.
In practice, that calls for education marketing campaigns designed by study mode. The message, the channel and the budget that work for an on-campus degree do not serve an online postgraduate course without adjustment.
So educational CAC has to be read against the student's full lifecycle. The cost of a lost enrolment shows the size of the waste by programme, and the ROI of student retention shows why keeping someone who already enrolled costs less than winning a new one.
How do you calculate acquisition cost by programme?
Separate each programme's direct investment, such as segmented campaigns and commissions, apportion the shared costs by each one's share of leads or enrolments, and divide the total by the number of enrolments that programme generated in the period.
The apportionment is the part that demands judgement. Brand budget, team salaries and tools serve every programme at once, so pick one distribution key, by share of leads, of enrolments or of direct investment, and keep the same key across every cycle.
In projects run by mkt4edu, that calculation only holds when the full cycle, from lead to enrolment to revenue, closes inside the CRM (Customer Relationship Management, the platform managing relationships with leads and students).
In those projects, the data lake returns calculated properties to the CRM, such as revenue and LTV per student. With that, ROI (Return on Investment), ROAS (Return on Advertising Spend) and cost per enrolment are read in the same place where the funnel runs, with no parallel spreadsheet.
That design depends on one operational detail that decides everything: the lead's source has to travel all the way to enrolment, through UTM parameters (the codes identifying channels and campaigns in the URL) and the form fields. Without that link, CAC by channel simply does not add up.
Building that structure is project work, not reporting work, and it usually falls inside the scope of a data-led education consultancy. A CRM implementation designed for recruitment is born with those fields, the apportionments and the revenue properties already wired to the funnel.
Which errors distort CAC?
The errors that distort CAC most are counting paid media alone, mixing new customers with renewals, mismatching the cost period and the conversion period, losing the lead's source midway down the funnel and treating cost per lead as if it were the final cost. Each one pushes the number away from reality.
It is worth examining each trap closely, because they all look harmless while they happen:
- Counting paid media alone. CAC comes out artificially low, salaries, tools and agency disappear from the figure, and campaigns look more efficient than they are.
- Mixing new and recurring. re-enrolments and renewals inflate the denominator and push CAC down on paper, with no extra new customer at all.
- Mismatching the periods. in long cycles, August's investment produces January's enrolment; comparing cost and conversion in the same month punishes the start of the campaign and rewards the end.
- Losing the lead's source. forms without tracking break the attribution, and CAC by channel becomes a guess.
- Confusing CAC with cost per lead. a channel with cheap contacts and weak conversion delivers a high CAC; optimising for the lead rather than the customer sends budget to the wrong place.
The map of lead loss in the enrolment funnel helps locate where attribution breaks, which is almost always the same point where the revenue escapes.
None of these errors is born of bad intent, they are born of month-end haste. The protection is defining the composition of the figure once, in writing, and repeating the same criteria across every cycle.
The same applies to digital marketing strategies: the more active channels there are, the more CAC depends on consistent attribution across platforms.
Frequently asked questions about customer acquisition cost
Measure or reduce customer acquisition cost: which comes first?
Measuring comes first, because reducing a badly calculated customer acquisition cost is optimising in the dark: the wrong channel gets cut, a drop that was only a change of criteria gets celebrated, and the next marketing budget is born crooked.
The sequence that works has three moves. Close the composition of the figure in writing, standardise the measurement period and make sure the lead's source reaches the enrolment or the contract.
With that scorecard in place, every unit invested gains a reading of return, and comparisons between channels, programmes and study modes finally mean something.
After that tidying up, it makes sense to attack the number. The seven levers to reduce CAC in student recruitment only work on that base: a CAC measured with criteria, ready to point out where a cut yields more enrolments for the same investment.











 Portugal