


Every educational institution knows how many students enrolled this term. Few know, with the same precision, how many will leave, why they will leave and what could have been done six weeks earlier. That gap is what a student retention strategy closes: it swaps the end-of-term reaction for a continuous process.
The problem is that "strategy" has become a generic label for any action against dropout: a re-enrolment discount, a call from the course coordinator, an email to whoever disappeared from the VLE (Virtual Learning Environment). None of them, on its own, is a student retention plan.
What follows is a method: six steps in sequence, from the dropout-rate diagnosis to ROI (Return on Investment), with named tools and defined owners.
What is a student retention strategy, and why is a discount not one?
A student retention strategy is a permanent process that defines how the institution identifies dropout risk, acts on each cause and measures the result by cohort. It has an owner, a tool, a cadence and a target. The re-enrolment discount is a one-off action: it hits a single cause and arrives once the decision to leave has been taken.
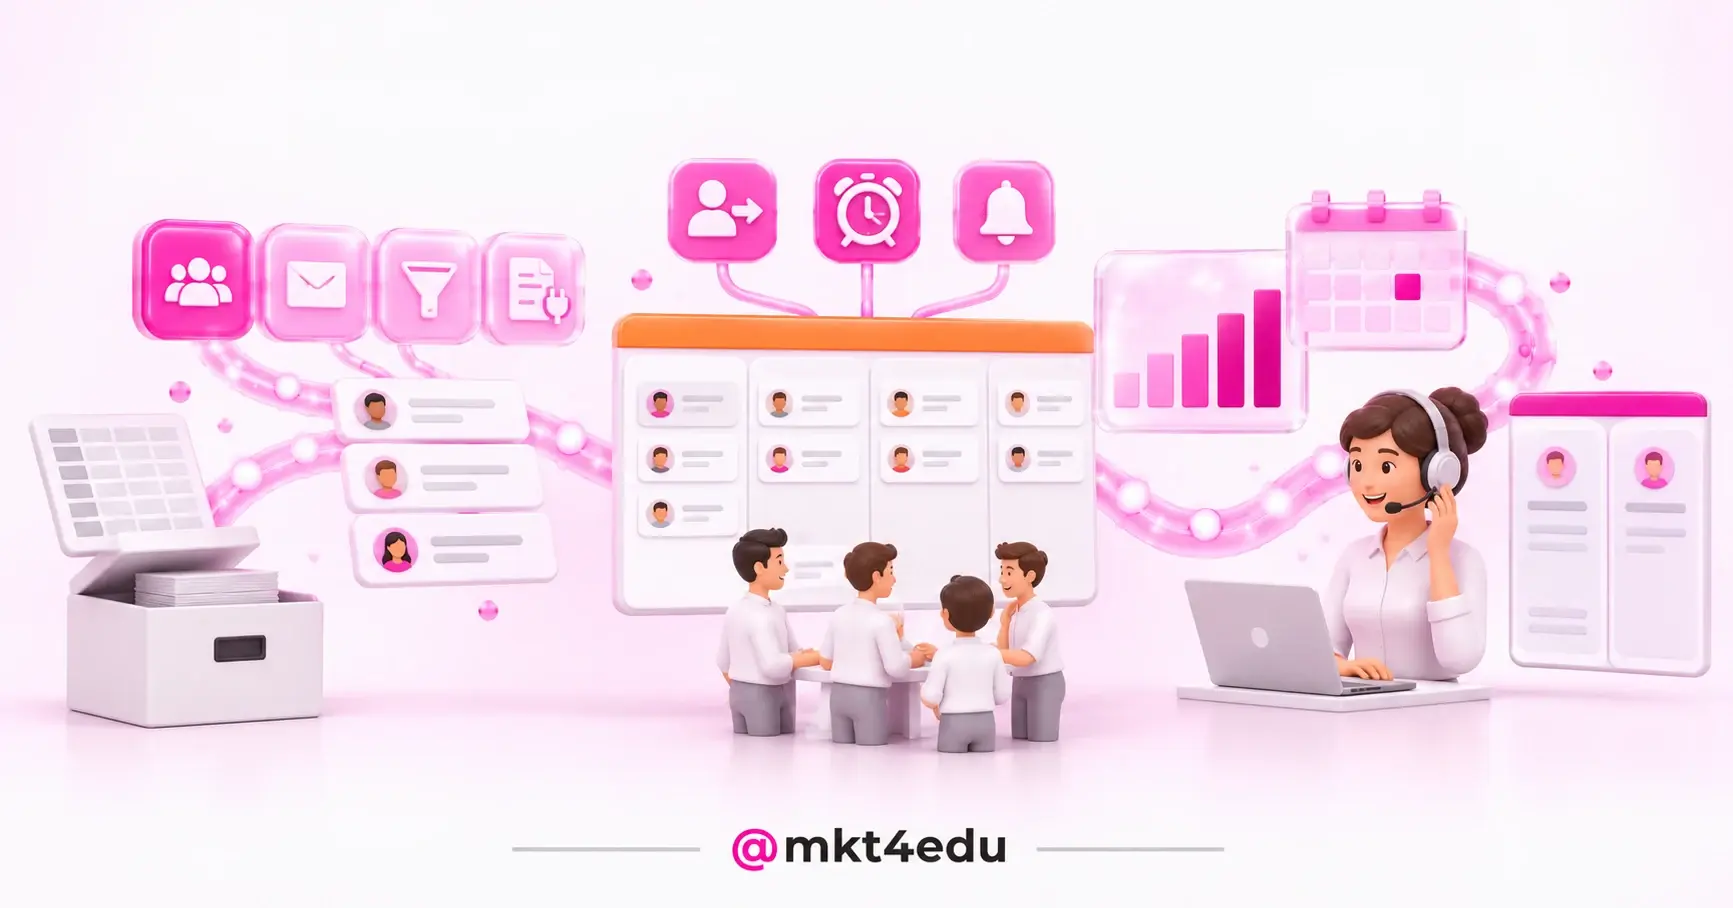
 Caption: a student retention strategy links the dropout diagnosis to the risk score in the CRM, the relationship cadence and the ROI of every enrolment kept
The size of the problem explains the difference. Brazil's 16th Mapa do Ensino Superior, published by Semesp, shows that in 2024 total dropout in on-campus courses reached 24.8% and the total rate in distance learning reached 41.6%, across all networks. In the private network the figures were 26.6% on campus and 41.9% in distance learning.
The full trajectory is harsher. In the 2020 to 2024 cycle, the cumulative drop-out rate in the private network reached 64.7% overall and 68.1% in distance-learning courses. The indicator measures the share of entrants who had left by the reference year, so it accumulates over the cycle rather than describing a single year.
Dropout in higher education therefore starts early and is not an end-of-term event. With distance learning accounting for 50.7% of the country's 10.2 million enrolments in 2024, distance-learning dropout has become the centre of the equation for any private institution, because there the exit is faster and quieter.
Step 1: how do you calculate the dropout rate and the cost of each enrolment lost?
The first step of a student retention strategy is measuring dropout with segmentation. The dropout rate for a period is the number of students who neither renewed their enrolment nor completed the course, divided by the total enrolled at the start of the period. That number only becomes a diagnosis when it is broken down by course, shift, delivery mode and term.
The average hides the real problem. An institution with 20% dropout may have 9% in evening Law and 45% in the first term of a distance-learning course, and the action for each case is different.
The second number is the cost of an enrolment lost: the revenue the student would still generate until graduation, plus the CAC (Customer Acquisition Cost) spent to enrol them and the cost of replacing the place. That calculation is where it becomes clear why retaining costs less than recruiting, and the ROI of retention is born of that asymmetry.
The diagnosis comes out of the academic system, with enrolment, attendance and grades, and out of finance, with invoices and arrears. Crossed in a spreadsheet, they form the dropout heat map: where it concentrates, when it happens and how much it costs.
It is from that map that the next steps decide how to retain students in each segment, instead of applying the same action to everyone.
Step 2: how do you segment students by dropout risk?
Segmenting by risk means grouping students by the likely cause of dropout, because each cause calls for a different action and a different owner. The four most recurrent families are financial, academic, engagement and belonging. A student can fall into more than one, and the combination is usually the strongest risk signal.
The financial cause shows up as a late invoice, a renegotiation request or a lost scholarship. Arrears are the most visible signal, but also the latest one: by the time a student stops paying, they have often already stopped attending.
The academic cause shows up as failure, attendance below the minimum and low marks in the first assessments, and it concentrates in the first term, when the student finds out whether the course matches what they expected.
The engagement cause reveals itself in behaviour: days without logging into the VLE, assignments not submitted, tickets left unresolved. In distance-learning dropout this group is decisive, because platform access is the only measurable form of presence.
The belonging cause is the hardest to capture. It shows in the student who does not know the coordinator and takes part in no group. Student persistence depends as much on belonging as on grades, and the student experience in the first 60 days defines much of that bond.
The deliverable of this step is a simple matrix: segment, signal, group size and planned action. Students with two or more signals go straight to high priority.
Step 3: which signals does the education CRM need to cross to predict dropout?
The education CRM needs to receive academic, financial and service data in a single record per student, because dropout risk only appears in the crossing. A low grade on its own is common; a low grade plus ten days without VLE access plus an overdue invoice is a student about to leave. Without integration, each department sees only a fragment.
A CRM (Customer Relationship Management) is the software that centralizes all your customer information and interactions in one place. In education the "customer" is the student, and the interaction includes the class watched, the invoice paid and the question answered.
In HubSpot, that crossing uses custom contact properties such as last VLE access, partial average and financial status, plus lifecycle stages adapted to mark the student as active, at risk, recovering or departed.
With the signals in one place comes the risk score: each signal gets a weight, the CRM adds up the points and triggers the workflow when the student crosses the cut-off line. That is how the CRM detects dropout risk in time, without depending on someone opening a spreadsheet on Friday.
A rules-based score is enough to start. The next layer is AI (Artificial Intelligence) for predicting dropout, which learns from previous cohorts which combinations of signals preceded an exit. Using AI to predict dropout requires a clean historical base, with at least two complete cycles.
An AI agent works at the front line: it reads the score, opens the WhatsApp conversation with the at-risk student, works out whether the problem is financial or academic and routes it to the right person. The AI agent does not replace the coordinator; it guarantees that no high score is left without contact.
Deploying AI agents integrated with the CRM and structuring HubSpot CRM for that crossing are services mkt4edu delivers to institutions, with cases of schools that moved from separate spreadsheets to a single score per student.
One limit belongs in the design from the start: data protection law. Performance, financial status and access are personal data, and processing them for retention requires a legal basis, a stated purpose and restricted access.
Step 4: how do you build the relationship cadence by risk segment?
The relationship cadence is the sequence of contacts each risk segment receives, with channel, timing, content and owner defined. It turns the score into action: when a student enters a segment, the CRM sends the first message, schedules the human task and records the answer. Without a cadence, the score is just a number nobody reads.
The channel depends on the cause: WhatsApp for the first contact and the reminder, email for long-form content, a call and a tutor meeting for high risk. The critical moments are the first six weeks, the first grades, the arrears period and the weeks leading up to re-enrolment.
This is where inbound marketing strategies applied to the enrolled student come in. The inbound methodology builds relationships with useful content instead of interruption, and it does not end at enrolment: the first-term guide and content about the course's job market keep the student engaged before any risk signal appears.
At re-enrolment the game shifts to inbound sales strategies, in which the rep serves each lead individually, considering their specific pains and goals. The same applies to the student: the renewal conversation starts from what they lived through during the term, not from a generic invoice.
Here is how a relationship cadence by segment is organised when every row has a signal, an action, an owner and a deadline:
|
Segment |
Signal in the CRM |
Action |
Owner |
Deadline |
|
Financial |
Invoice overdue by more than 15 days or a renegotiation request |
WhatsApp with instalment and scholarship options; a call if there is no answer |
Finance |
48 hours |
|
Academic |
Failure, attendance below 75% or a low mark in the first assessment |
Conversation with the coordinator, tutoring and a study plan by email |
Course coordination |
5 working days |
|
Engagement |
7 days without VLE access or an assignment not submitted |
Message from the AI agent on WhatsApp; the tutor steps in if there is no reply within 24 hours |
Customer success / tutoring |
24 hours |
|
Belonging |
No participation in events, groups or support in the first 60 days |
Personal invitation to the class group, mentoring and a course event |
Marketing and coordination |
15 days |
|
Pre-re-enrolment |
Re-enrolment not started 30 days before the deadline |
Email and WhatsApp sequence with next term's benefits; a consultative call for high scores |
Student relations / registry |
30 days |
Table: cadence model by risk segment inside a student retention strategy; signals and deadlines should be calibrated against each institution's own dropout history
Marketing automation handles the volume of the cadence, and a person steps in where the row calls for a conversation. A deadline without an owner becomes a suggestion, and a segment without a deadline becomes a queue.
Video: case from the mkt4edu channel on re-enrolment automation, the operational side of a student retention strategy
Step 5: who is responsible for student retention at the institution?
Student retention needs a single owner with the authority to hold departments to account, plus owners per segment who run the cadence. In most institutions the owner is academic leadership or an education customer success team created for the job. The other areas answer for their own rows, but the consolidated indicator carries one name only.
The split that tends to work is by cause: finance handles arrears; coordination handles academic risk; education customer success or distance-learning tutoring handles engagement; and marketing handles belonging and the content of the cadence.
Each responsibility needs an SLA (Service Level Agreement): the maximum time between the signal in the CRM and the first human contact. The process rests on a weekly meeting per course or campus, to unblock cases, and a monthly one with leadership, to compare indicators against the target.
Recruitment and retention must sit in the same design, because the student who enrols poorly informed about the course is the first to leave. Integrating student recruitment and retention starts in the recruitment pitch: a promise aligned with what the course delivers cuts first-term dropout.
The reverse holds too: dropout data by course feeds the next cycle's student recruitment strategy, revising the profile of whoever the institution attracts.
Step 6: which retention targets, KPIs and ROI should you track?
Retention targets must be set by cohort and by segment, never only by the institution's average. The central KPIs (Key Performance Indicators) are retention rate per period, re-enrolment rate, arrears, satisfaction measured by NPS (Net Promoter Score) and preserved revenue. The ROI of retention closes the loop: it compares the revenue kept with the cost of the programme.
The retention rate mirrors the dropout rate in higher education: the number of students who renewed divided by the number eligible to renew. The re-enrolment rate measures the same event inside the official renewal window.
Arrears enter as a leading KPI, because they usually precede the exit. NPS, with its 0-to-10 recommendation question, measures belonging and, applied by course, points to where the student experience is degrading before the decline turns into dropout.
Preserved revenue multiplies the students retained above the baseline by the average tuition fee and the months remaining until graduation. The ROI of retention divides that revenue, minus the cost of the programme, by the cost of the programme, which includes tooling, team hours and discounts granted.
Re-enrolment campaigns are educational marketing campaigns: they have an audience, a message, a channel and a conversion target. Like every other educational marketing campaign, they call for the same planning and measurement rituals as recruitment, and they must fit inside the institution's educational marketing strategy rather than run alongside it.
Measurement uses the tools marketing already knows: GA4 shows whether the re-enrolment page produces engaged sessions, which are the ones that last longer than 10 seconds, record a key event or reach two or more page views, and HubSpot shows opens, clicks and replies by segment. The crossing tells you which message made the student renew.
Video: 4RevOps audioblog on the metrics that measure a student retention strategy
Which common mistakes break a student retention strategy?
The most common mistakes in a student retention strategy are starting with the tool instead of the diagnosis, treating every student with the same cadence, leaving the score without an owner and confusing dropout with price. None of them is technological: all are process failures, and they show up in institutions that have already invested in a CRM and keep losing students.
The first mistake is buying the CRM before knowing what to cross. The tool arrives, the integrations drag on, and the team goes back to the spreadsheet. The right order is diagnosis, segmentation and a list of signals, and only then the system.
The second is the orphan score: the CRM calculates the risk, the list exists, and nobody has the task of calling. A score without an SLA and without an owner is a report, not retention.
The third is confusing student dropout with a pricing problem. A discount solves part of the financial segment and none of the other three, and it teaches the student to wait for the discount before renewing.
The fourth is ignoring that the student has changed. HEPI's Student Generative AI Survey 2026, run by Savanta with 1,054 full-time UK undergraduates, shows that 95% of students report using AI in at least one way. The sample is British, but a plan that does not understand how that student studies and communicates already starts out of date.
There are mix mistakes too. Confusing marketing strategies with an email blast, or digital marketing strategies with an ad, leads to investing in volume where the problem is relevance. The digital marketing strategies that work in retention are the finely segmented ones, not the broad-audience ones.
When should you bring in an educational marketing agency for retention?
Outside help makes sense when the institution already knows its dropout by segment but has neither the team nor the time to integrate systems, configure the score and run the cadence.
In that scenario, an educational marketing agency or a consultancy structures the CRM, builds the workflows and trains the team, while the institution keeps the pedagogical decisions and the human contact.
The clearest sign is a finished diagnosis and a stalled execution. If the dropout map has existed for two terms and the cadence never left the page, the bottleneck is operational, and that is the work an educational marketing agency with HubSpot experience solves faster than an internal hire.
The second sign is a lack of integration. When recruitment, retention and institutional communication run in separate systems, the student receives contradictory messages. A unified educational marketing strategy puts the inbound marketing strategies of recruitment and the inbound sales strategies of re-enrolment in the same CRM, with the same marketing strategies behind them.
What the institution should not outsource is the bond. A coordinator who knows the student by name and a tutor who replies within hours are the human part of persistence. Outside help exists so that those people receive the right list, at the right moment, with the full context.
Frequently asked questions about student retention strategy
What should you prioritise first in a student retention strategy?
To decide how to retain students with the budget available, the priority is a segmented diagnosis. Before any tool, cadence or campaign, the institution needs to know in which course, delivery mode and term dropout concentrates, and how much each enrolment lost costs.
That diagnosis decides the budget and the segment to start from, and it is usually what convinces leadership to treat retention as a process.
After the diagnosis, the second priority is a single segment with a complete cadence: signal in the CRM, action, owner and deadline. Starting with the largest group, usually the financial one or engagement in distance learning, shows a result within one re-enrolment cycle and provides a base to expand from.
Only then do the score, AI for predicting dropout and the AI agent come in. They multiply a process that already works, but they do not fix a process that does not exist.
If your institution has the diagnosis ready and the cadence stalled, or wants to build its student retention strategy from scratch with HubSpot, a conversation with the mkt4edu team is worth it: you leave it with the six steps applied to your own scenario and an estimate of preserved revenue to defend the programme internally. Talk to us and let's build your success together.















 Portugal