


Almost every company knows how many leads came in last month. Few can say, without opening five spreadsheets, at which step those leads stopped moving forward.
The difference between the two groups is not the amount of data, it is the design. A sales funnel read stage by stage shows where volume evaporates, while a channel report only shows how much came in.
This article rebuilds that whole analysis. It starts with what to measure at each step, moves through the map built in Funnelytics and ends with the reading that separates normal fluctuation from a real bottleneck.
Why does sales funnel analysis change the conversion rate?
Sales funnel analysis changes the conversion rate because it moves the question. Instead of asking which channel brought the most people, the analysis asks at which step those people stopped. The answer points to one concrete spot to fix, and a concrete spot is the only thing an experiment can attack.
The funnel is the model that represents the buying journey, from first contact to decision. Split into awareness, interest, consideration and decision, it organizes what a lead does before buying.
Without that split, diagnosis becomes guesswork. A 30% revenue drop can come from poor traffic, a broken form, a weak proposal or slow follow-up, and all four hypotheses produce exactly the same number at month end.
With the split, each hypothesis gets an address. Poor traffic shows up in time on the landing page. A broken form shows up in the drop between visit and lead. The proposal shows up in the move from opportunity to close.
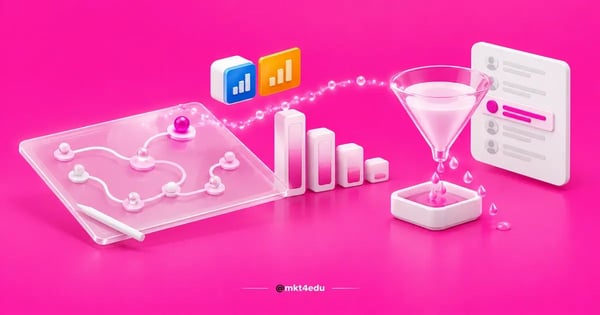 Caption: sales funnel analysis points at the exact stage where conversion drops, and that is the spot an experiment can attack
This is the groundwork behind any CRO (conversion rate optimization) program. You can only optimize what you can see in isolation, and the funnel is the instrument that isolates.
Two things are worth separating here. Low volume at the top is an acquisition problem, solved with media, content and distribution. A drop between stages is an experience and offer problem, solved with pages, messaging and sales process.
When one report covers both, teams tend to buy more media to compensate for a bottleneck sitting three steps further down. The math works for a month and gets worse the next, because cost per lead climbs while lead conversion into revenue stays flat.
Serious inbound marketing strategies start from this diagnosis, not from a hunch about channels. The same holds for inbound sales strategies, since the sales team needs to know which step is handing over cold leads.
In practice, inbound marketing strategies and inbound sales strategies share the same map and disagree about where the loss sits. A funnel read stage by stage settles that argument with a number instead of an opinion.
What are the funnel stages and what should you measure in each?
Funnel stages carry different names from company to company, but the measurement logic is stable: every stage needs an entry volume, an exit volume and an average time in stage. Without time, the map shows where the lead stopped and hides how long it has been stopped there. Measuring all three is what separates the leads that move on from the ones that quietly drop out between two neighboring stages.
The structure most used in digital acquisition has four steps, and each one calls for its own indicator. Here is how that organizes:
|
Stage |
Pass-through metric |
Bottleneck signal |
|
Visit |
Visit to lead |
High exit rate on the form page |
|
Lead |
Lead to answered contact |
Hours between signup and first attempt |
|
Opportunity |
Contact to proposal sent |
Proposals sitting without a reply |
|
Decision |
Proposal to signed contract |
Discount requested on nearly every close |
Table: Pass-through indicator and warning signal for each funnel stage in digital acquisition.
The table solves the volume diagnosis. It does not solve the intent one, and that is where understanding the purchase decision process matters: two people sitting at the same step can be weeks apart from each other.
In B2B (business to business) selling, that distance grows. The B2B buying journey involves more than one decision maker, budget approved in another cycle and technical criteria marketing rarely sees.
That is why the B2B buying journey needs one extra step on the map: internal validation. It never shows up on a form, yet it explains why a proposal sits still while the contact has not lost interest at all.
Mapping the purchase decision process at that level of detail avoids the most common and most expensive reading, which is treating silence as a no. In a long cycle, silence is usually waiting.
Teams tracking the pirate funnel and its acquisition and retention metrics already work with a version of this reading, with the difference of including what happens after the purchase.
What does Funnelytics do today for sales funnel analysis?
Funnelytics is a funnel mapping tool: you draw the customer path on a canvas and connect that drawing to real traffic and conversion data. The product is split into two lines, Funnelytics Journeys and Funnelytics Ecom, and it works in three layers over the same map.
The layers explain what the tool delivers at each level of use:
- Map. The funnel drawing itself, with more than 100 ready-made templates and steps linked in sequence.
- Forecast. A projection of funnel results with best case and worst case scenarios, before media money is spent.
- Performance. Real data landing on the map, with path attribution and KPI monitoring with goals and alerts.
Two named features deserve attention from anyone analyzing funnels. Vision AI is the product's insight assistant, included in the Performance Business plan. The LTV Profit Map shows 365-day LTV (lifetime value, the value a customer generates over time) by acquisition path.
The LTV Profit Map is the feature that most changes the conversation with the media team. It compares acquisition paths by what they return over a year, not by last week's cost per lead.
On integrations, the list covers Zapier, Webhooks, Google Ads, Meta, HubSpot, GoHighLevel and Shopify. That is enough to cross spend on marketing campaigns with what happened inside the map. Without that cross-reference, marketing campaigns end up judged by cost per click, the indicator furthest from revenue.
Two points need to be clear for anyone who knew the tool years ago. A/B testing and cohort analysis do not appear in the product's current material. The closest thing to cohorts today is the LTV Profit Map, which groups customers by acquisition path and follows the return across 365 days.
On price, the plans page labels monthly values. In the Journeys line, the monthly range runs from US$ 39 on Map Pro to US$ 129 on Performance Pro and US$ 349 on Performance Business.
In the Ecom line there is a free Essentials plan, described as “free forever”, and Ecom Insights at US$ 2,500 per month, with the page itself noting that the figure depends on the store. None of these numbers is an annual price.
Video: audio walkthrough on how to use Funnelytics in practice, on the mkt4edu channel (in Portuguese)
How do you build the sales funnel map in Funnelytics?
Building the sales funnel map starts outside the tool. Before opening a canvas, write in one line which decision the analysis has to support, because a map drawn without a question becomes a pretty, useless diagram. With the question settled, the drawing takes minutes.
The sequence that works has four moves.
- Define the question and the success metric. “Why do enrollments drop after the form” is an analyzable question; “improve the funnel” is not.
- List the real steps, not the ideal ones. Use the pages and events that exist today, including the ugly ones, like the thank-you page nobody has reviewed.
- Draw the path on the Map layer. Start from a template when the structure is common, such as gated content capture or webinar signup, then adjust the steps.
- Connect the data sources. Link media and CRM through the available integrations so the Performance layer receives numbers instead of estimates.
The step that stalls new teams most is the third, because the temptation is to draw the funnel you wish you had. A map with a step nobody measures returns a hole in the middle of the analysis.
Tracking detail usually decides data quality. Teams that standardize events with Google Tag Manager to monitor sales reach the map with consistent names and avoid counting the same conversion twice.
If the goal is to tie the map to session behavior already collected, integrating Funnelytics with Google Analytics handles the traffic side, and segmenting leads inside the tool handles the audience side.
For anyone building a first map, the detailed walkthrough on how to set up your first funnel in Funnelytics covers the operational part step by step.
Video: audio walkthrough on funnel marketing and what the map makes easier day to day, on the mkt4edu channel (in Portuguese)
How do you read the map and find the stage that kills lead conversion?
Reading the map means comparing each pass-through against a reference, never looking at a number in isolation. The stage that kills lead conversion is not the one with the lowest absolute volume, it is the one with the widest gap between what enters and what leaves compared with that same step's history.
The reading follows an order that prevents rushed conclusions.
Start with the largest percentage drop between two neighboring steps. It is the most likely bottleneck, and the one with the best return per hour spent on a fix.
Next, separate structural decline from fluctuation. A pass-through that fell one week and recovered the next is noise. One that fell and stayed low for three weeks is a problem.
It is worth asking what each drop actually represents before touching anything. A pass-through that stays low week after week stays low for a reason, which means the cause sits in that step and not in the calendar. And when two neighboring pass-throughs fall together, start with the one closest to the money.
Then look at time. Two stages with the same conversion rate can be in opposite health if one converts in two hours and the other in nine days.
Finally, cross the reading with acquisition path. The same landing page tends to convert differently by source, and the LTV Profit Map helps show whether the cheapest path is also the most profitable across the year.
In this reading, UX (user experience) deserves the same attention given to media. Forms with too many fields, missing social proof and slow mobile loading all cut pass-through without appearing in any channel report.
Offer and content belong in the same calculation. A lead only moves forward when it finds what it needs at that step, and a page lands the right message when whoever wrote it knew which stage of the journey the reader was in.
UX work and offer work meet right here. When the drop is concentrated between visit and lead, the problem is rarely traffic, and strategies to raise the conversion rate in the funnel go straight at that point.
When the drop sits between lead and answered contact, the diagnosis leaves marketing. Reviewing the stages of the sales process and how to carry them out usually pays more than rebuilding the capture page.
How to run an A/B test outside the tool and read it on the funnel map?
A/B testing does not appear in Funnelytics' current material, so the experiment runs outside and is read inside the map. In practice, the landing page builder, the email platform or the ads manager creates the variations, and the funnel map shows each one's effect on the pass-through between funnel stages.
Knowing how to run an A/B test in this arrangement comes down to four parts.
- Pick one step only. Test the capture page or the follow-up email, never both in the same window.
- Create the variation in the source tool. The page builder, the email platform or the ads manager handles the traffic split.
- Separate the versions on the map. Give each variation its own URL or event so the map can count them independently.
- Read the pass-through, not the click. The winner is whatever lifts conversion at the next step, not whatever earns more clicks on its own page.
The most expensive mistake in how to run an A/B test is calling the winner on the wrong indicator. A variation with a more aggressive headline can raise lead volume and cut quality, which surfaces two stages later as rejected proposals.
The decision criterion has to be set before the test starts. If the cutoff metric is lead conversion into opportunity, the signup count becomes context, not verdict.
That discipline is what separates CRO from guesswork. In agency vocabulary, CRO marketing describes this cycle of hypothesis, experiment and result reading applied to each step of the funnel.
That cycle starts with what we call a test queue: one hypothesis at a time, always on the step with the largest percentage drop. Running that queue at the right point is what makes the funnel more efficient without asking for more media spend. In the end, the most effective funnel is rarely the prettiest one on the canvas: it is the one with the fewest holes between one stage and the next.
People searching for CRO marketing usually want to know where to start, and the answer is normally the step with the largest percentage drop and the largest absolute volume at once. It is worth reviewing what CRO is and how it works and the benefits of applying CRO in marketing before lining up the first tests.
In low-volume operations, A/B tests take a long time to reach significance. In those cases, a qualitative reading of the map, plus session recordings and interviews with buyers, tends to anticipate the diagnosis a test would confirm months later.
When is it worth replacing Funnelytics with another funnel analysis?
Switching tools makes sense when the nature of the question changes. A visual map is strong for seeing paths and pass-through between funnel stages; it is weak when the doubt is about product usage, in-app recurrence or deep cohort history, which does not appear in the product's current material.
Three situations usually point to a switch:
- In-product retention analysis. Questions about weekly usage and recurrence call for product analytics software.
- Very high event volume. Operations with millions of events per month tend to need a data warehouse and their own queries.
- Locked budget. The Journeys monthly range starts at US$ 39, and there are cases where the CRM you already pay for returns the same diagnosis.
The practical test is simple: if the map is only ever used to draw and never to decide, the problem is process, not software. Switching tools in that scenario just postpones the conversation.
To compare options before migrating, the roundup of the best Funnelytics alternatives for the sales funnel lists what each type of tool handles well.
It is worth remembering that no tool produces a hypothesis. The digital marketing strategies holding up the funnel still come from people who know the audience, and the map only confirms or denies what was assumed.
Map and digital marketing strategies work as a pair in that division: one shows where to fix, the other defines what to offer at that point. Changing software without revising the marketing strategies changes the screen, not the result.
Frequently asked questions about the sales funnel
Where should you start your sales funnel analysis next cycle?
Start with the most expensive step, not the easiest one. In almost every operation, the biggest revenue loss sits in a single pass-through of the sales funnel, and finding which one takes less than a week when the data already lives in the site and the CRM.
The order for next cycle fits in four decisions. Choose the question the analysis has to answer. Draw only the steps you measure. Identify the largest percentage drop. Run one experiment at a time on that point.
It is worth resisting the urge to rebuild everything at once. An over-complete map in month one delays the first decision, and the first decision is what generates the learning that guides the rest.
When the map already points at the bottleneck and execution capacity is missing, bringing in outside support for the testing cycle makes sense. CRO work covers experiments and the conversion rate, while content planning feeds the top of the funnel with material aligned to each stage of the buying journey.
To discuss your funnel with people running digital acquisition every day, talk to the mkt4edu team and bring the map you already have, even if it is incomplete.














 Portugal