


Small businesses decide on spending with thin margins, and every new subscription has to justify its own cost. Funnelytics enters that calculation as a visual sales funnel mapping tool, starting at US$ 39 per month, with no free plan available.
The decision point is not the feature list, it is data volume. A company that already runs paid traffic and follows the lead journey has something to draw, while a company with occasional sales does not yet.
This article covers price, adoption criteria, implementation in five steps and the CRO reading that turns the map into tests. At the end, a verdict on when to subscribe and when to wait.
Is Funnelytics built for small businesses or only for large operations?
Funnelytics works for small businesses that already invest in paid traffic and need to see the customer journey stage by stage on a single map. Outside that profile, with occasional sales and little data volume, the tool becomes a monthly cost without a reading that justifies it.
The practical criterion is volume. A funnel with a few hundred sessions per month produces no visible difference between stages, and the map looks good without pointing to a single decision.
B2C (Business to Consumer) companies with a high average ticket usually extract more value, because the cycle is short and volume arrives fast. Mentoring programs, immersions and premium products sit in that group.
B2B (Business to Business) services with direct selling also fit, as long as the team records every stage. When half the process happens offline, the map is born incomplete and leads to the wrong conclusion.
Funnelytics itself publishes a case in which a page with more than 4,000 visitors sent around 14.2% to the catalog, and 125 of the 587 visitors at that stage filled out a form. That is vendor marketing material, with no independent audit.
Figures like that indicate an order of magnitude, not a result to expect. What your operation will measure depends on the offer, the channel and the quality of the database, and only shows up after a few weeks of your own tracking.
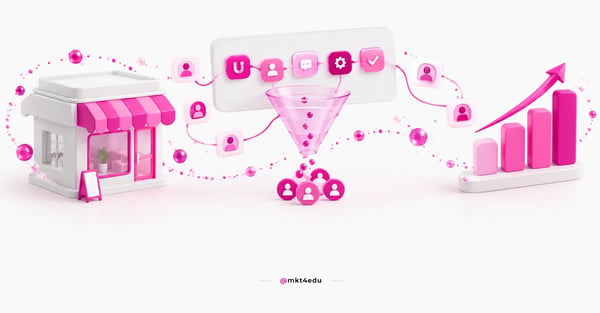 Caption: The funnel map shows, stage by stage, where small businesses lose lead conversion.
The audio post above explains what Funnelytics is and what it is used for, and it is narrated in Portuguese.
Before subscribing, check what Google Analytics already answers for you. If the question is only about volume per page, the answer is there, at no new cost and with no implementation project.
Teams comparing tools usually look first at the return on investment of the mapping work, and not at how long the feature list is.
Video: what Funnelytics is and what it is used for, before a small business commits to a paid plan. Narrated in Brazilian Portuguese, with automatic captions available.
How much does Funnelytics cost for small businesses?
Funnelytics has no free plan. There are three paid plans, each opening with a trial at no charge: Map Pro, Performance Pro and Performance Business. Once the trial ends, the subscription is billed at the full price of the chosen plan.
The entry point is Map Pro, at US$ 39 per month after 7 days free of charge, and the two performance plans offer 14 days before the first debit.
|
Plan |
Monthly price |
Trial period |
|
Map Pro |
US$ 39 |
7 days |
|
Performance Pro |
US$ 129 |
14 days |
|
Performance Business |
US$ 349 |
14 days |
Table: Monthly figures for the three paid plans and each trial window. No annual figure is disclosed.
A free trial is not a free version, and the difference matters for planning. Once the window closes, there is no permanent no-cost tier to fall back on: the account either becomes a paid subscription or is shut down.
For small businesses, the right question is whether the map changes at least one media decision per month. When it does, the entry plan looks cheap next to what an inefficient channel burns in ads.
The short window on the entry plan calls for preparation. Arrive at day one of the trial with your data sources ready to connect, because 7 days leave no room to hunt for every tag.
Setup mistakes shorten that window even further, and the most common mistakes when using Funnelytics show up right at event tagging.
How do you implement Funnelytics in 5 steps at a small company?
Implementation fits into five steps: connect the data sources, start from a ready-made template, map the real customer journey, adjust marketing strategies based on the reports and tie the funnel to RevOps (Revenue Operations). Each step depends on the one before it.
Step 1: connect your data sources
The first step connects the tool to what already runs in the business. Google Tag Manager is usually the starting point, because it centralizes tag firing without pulling the development team in for every adjustment.
The second useful connection is the CRM. With HubSpot wired into the map, sales and service data join the same reading, and the funnel stops ending at the form submission.
Teams already running Google analytics save time by integrating Funnelytics with Google Analytics before drawing any stage.
Without that connected base, the map becomes a drawing of intent. It shows the path you imagine, not the path people actually walk.
Step 2: start from a ready-made template
There is no need to draw the sales funnel from scratch. The template library carries models by business type, and the initial work comes down to picking the one closest to your operation.
Service models suit long cycles, with several meetings before the proposal. Digital product models suit short cycles, where ad, page and checkout happen on the same day.
The template speeds up the first version and avoids the blank page. It also exposes stages the operation skipped, such as follow-up after the sale.
Step 3: map the real customer journey
The third step adjusts the model to reality. With the data connected, the map shows where the customer journey stalls and which campaigns sustain the volume that reaches the bottom of the funnel.
The most frequent bottlenecks appear at checkout and in the gap between sign-up and the first sales contact. In both cases the loss is large and the fix is usually cheap.
It pays to review the practices for mapping the customer buying journey before closing the design, because an invented stage contaminates the whole reading.
The lead journey is rarely linear. People come back, compare and abandon, and the map has to accommodate that back and forth instead of forcing a straight line from ad to purchase.
The customer journey analysis inside the CRM completes the reading, since the service history explains much of the loss that the map only flags.
Step 4: adjust marketing strategies with data
The fourth step turns reading into decisions. With the reports in hand, you can cut an inefficient channel, move budget to what converts and revise the marketing strategies behind each stage of the funnel.
The most direct effect shows up in CAC (Customer Acquisition Cost). Removing a channel that delivers volume without quality lowers the average cost without taking a single sale off the month.
Funnelytics itself publishes a three-month case with a 92.70% reduction in cost per lead. The figure comes from the vendor, works as an order-of-magnitude reference and does not replace a test run on your own data.
In your business, realistic gains come from small, repeated adjustments: a new CTA (Call to Action), a different page layout, an email flow rewritten around another promise.
Step 5: tie the funnel to RevOps
The fifth step takes the funnel out of marketing and hands it to the whole company. RevOps means running marketing, sales and service on one revenue reading, and the map becomes the shared reference for all three teams.
That alignment delivers three concrete things in the daily routine:
- Steadier revenue forecasting, because every stage now carries a known rate.
- Less rework across areas, since the definition of a qualified lead is shared.
- Sustainable growth, with budget decisions made on data rather than opinion.
The arrangement connects inbound marketing and inbound sales without friction, because content feeds the top and the sales team receives the context of every stage the contact has already walked.
In a small operation, the gain is speed. Whoever runs inbound marketing stops producing material blindly, and whoever runs inbound sales stops calling contacts that have shown no intent yet.
How do you turn the funnel map into a CRO strategy?
CRO is the discipline of raising the conversion rate of each stage instead of buying more traffic. The map provides the raw material for that work, because it shows where lead conversion drops and how much that percentage point is worth in revenue.
A CRO strategy starts at the biggest leak, not at the team's favorite page. If 60% of people vanish between cart and payment, no button-color test on the homepage will move the result.
The term CRO marketing circulates to describe that work when it lives inside the marketing team, with hypothesis, test and measurement in the same campaign cycle.
Landing pages and lead conversion hold most of the quick wins, because that is where the ad promise meets the form and the drop-off becomes visible.
Every test needs a written hypothesis first. Without one, the team changes three elements at once and loses any chance of knowing which of them caused the difference.
Teams that want to raise the conversion rate with the Funnelytics sales funnel gain by closing one test at a time and recording the result on the same map that produced the hypothesis.
A CRO strategy also looks after timing. A lead who waits two days for the first contact converts less, and that interval appears on the map as a drop between neighboring stages.
A well-tuned communication rule solves part of that loss without touching a single page on the site.
The result of CRO marketing compounds. Gains of two or three points in consecutive stages multiply into each other and change the final volume without adding a cent of paid media.
What are the benefits of Funnelytics for small businesses?
The core benefit is trading assumption for evidence in budget decisions. From there, three concrete gains appear for small businesses: clarity in the sales funnel, control over paid media and readiness to grow without losing track of the operation.
1. Full clarity in the sales funnel
The most common challenge in a lean operation is not knowing where leads stall. With the map wired to the data, each stage shows how many people entered, how many moved on and how many gave up.
That view changes the internal conversation. Instead of debating whether the campaign is good, the team debates why 70% of people abandon exactly the same screen.
2. Control over paid traffic
Investing in media without knowing what converts burns budget fast. The map separates campaign, ad and acquisition channel, and shows which of them deliver lead conversion and which deliver only visits.
The reading gets complete when the funnel stages inside the CRM follow the same cut, because the closed deal is the only final judge of any campaign.
3. Readiness to grow with consistency
Once the operation starts to scale, the questions get expensive. Hiring another salesperson, rebuilding the site or launching a new offer are decisions that ask for numbers, not intuition.
The map answers with an order of magnitude. If the bottleneck sits in service, hiring makes sense; if it sits on the page, the money goes to the customer experience on the site.
Customer experience improves as a side effect of the method, because every bottleneck you fix is one less point of friction for someone who already wanted to buy.
When does Funnelytics not pay off, and what should you use instead?
Funnelytics does not pay off when volume is missing, when selling happens offline or when nobody on the team will keep the map current. In those cases the monthly fee lands with no return, and free tools answer the immediate question.
Google Analytics covers traffic sources, most-viewed pages and basic conversions at no cost. For anyone still figuring out what to measure, it is enough for several months of operation.
A spreadsheet also solves more than it seems in a small business. Three columns with entry, contact and closing already expose the biggest bottleneck of the month, with no integration at all.
The second limit is maintenance. An outdated map misleads more than no map at all, because it lends confidence to a reading that no longer matches the current buying journey.
The third limit is scope. The tool shows what happened along the path, not why the person gave up. That answer comes from surveys, session recordings and conversations with customers.
It pays to test before deciding. The 7 or 14 days exist precisely so small businesses can find out, with their own data, whether the map changes any budget decision.
Frequently asked questions about Funnelytics for small businesses
Is Funnelytics worth subscribing to at your small business?
It is worth it when three things come together: paid traffic running, a buying journey with more than three stages and someone responsible for reading the map every week. With that, the fee pays for itself at the first channel you cut.
It is not worth it when selling is occasional or happens offline. In that scenario, Google Analytics and a simple spreadsheet deliver the same clarity with no new subscription in the budget.
The trial settles the question. Go in with your data sources ready, map one real funnel and check whether the map changes at least one budget decision inside the free window.
Operations that would rather design funnel, CRM and communication cadence at the same table can talk to the Mkt4edu team and start from a diagnosis of the current funnel.














 Portugal