




Add an AI agent to make calls and send messages on WhatsApp is the easy part. The hard part comes next: figuring out if it’s working, where it’s falling short, and what to tweak to boost sales.
The answer isn’t found in the volume of calls or in the gut feeling of someone monitoring from afar, but rather in the metrics of the AI SDR agent, organized in a dashboard that transforms hundreds of scattered records into clear decisions.
A good prospecting dashboard answers questions that change the course of the operation: how many real conversations took place, how people reacted, on which days and at what times outreach works best, and where efforts are being wasted.
When these numbers are visible, stopping the guesswork is no longer optional—it becomes routine.
What are AI SDR agent metrics?
AI SDR agent metrics are the indicators that show what happened during each contact made by an AI agent during the pre-sales process.
They measure the volume, quality, and outcome of calls and messages, and reveal whether the agent is qualifying leads for the sales team or simply using up attempts.
The role of an SDR—whether human or AI—is to generate qualified opportunities: approach the lead, determine if there’s a good fit, answer initial questions, and schedule a meeting with a sales representative.
Just like the work of a AI SDR agent takes place via voice calls and WhatsApp, the analysis of results must cover both channels and focus on the same thing: a contact that turns into a conversation, and a conversation that results in progress.
Measuring results matters because an agent’s speed and consistency are only justified if they produce results—and you can’t see that with the naked eye.
The urgency, incidentally, is backed by research. A study by the Harvard Business Review found that companies that respond to a lead within the first hour are much more likely to qualify it than those that take longer.
An agent who is available at any time solves this speed issue, but only the dashboard shows whether the conversation they generate is of high quality.
 Caption: Visual dashboard of AI SDR agent metrics for analyzing and optimizing prospecting.
Why isn’t a made call the same as a connection?
A dialed call is any attempt to dial a number. A connection is different: it only counts when a real human answers and stays on the line.
Voicemail, answering machines, and automated menus are not connections, even if the call goes through and the number appears as dialed in the report.
Confusing the two is the most common interpretation error. Those who look only at the total number of calls celebrate their effort, but it may not have resulted in a single conversation. That’s why the connection is the concept that underpins everything else on the dashboard: it is the true currency of voice-based prospecting.
The most practical and objective way to distinguish between call attempts and actual conversations is by duration. Very short calls are almost always answering machines, which hang up quickly; conversations with people tend to last longer.
It’s common to use a time threshold—around 80 seconds—below which the call isn’t counted as a connection. This isn’t a universal rule, but rather a criterion that effectively distinguishes human interactions from automated ones in most operations.
With this filter, the dashboard stops inflating the results with calls that were never actual conversations.
Which lead generation metrics should you track on the dashboard?
The essential metrics for a lead generation dashboard fall into three categories: effort, or how much the agent worked; reach, or how many actual conversations they generated; and quality, or how those conversations went.
Tracking all three together helps you avoid the trap of celebrating volume without results or dismissing a healthy operation just because a conversion rate seems low.
Five metrics form the basis for analyzing nearly any voice agent dashboard. Here’s how each one is organized:
|
Metric |
What It Measures |
How to read it |
|---|---|---|
|
Total Calls |
Total dialing effort during the period |
Shows the scale of the operation, not the result |
|
Total connections |
Actual conversations with people, exceeding the time threshold |
This is the number that actually generates opportunities |
|
Connection rate |
Percentage of attempts that turned into actual conversations |
Puts the volume into context and varies greatly by database and channel |
|
Average duration |
Average call duration |
Longer call durations suggest substantive conversations when someone answers |
|
Positive sentiment |
Percentage of conversations in which the lead responded positively |
Indicates whether the approach is being well received |
Table: Effort, reach, and quality side by side: no single metric tells the whole story.
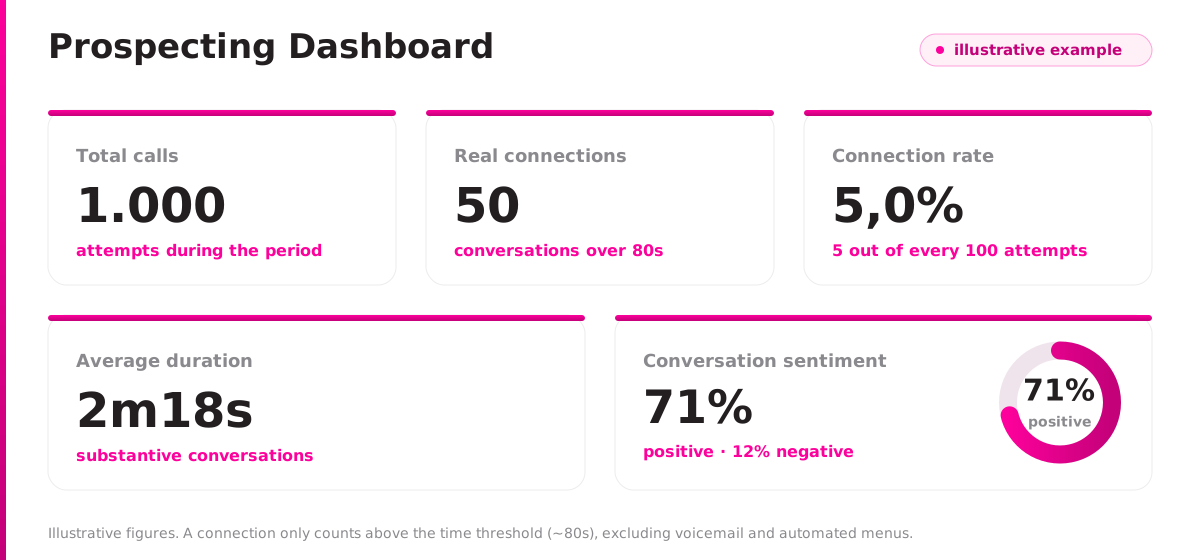
Image 01: Illustrative example of a prospecting dashboard with the five key metrics: total calls, actual connections, connection rate, average duration, and sentiment.
The correct interpretation involves a cross-analysis. Total calls alone is a vanity metric; connections indicate how many actual conversations took place; the connection rate puts this reach into context relative to the effort; and duration and sentiment reveal whether these conversations had substance.
These metrics also connect to the rest of the funnel, and choosing the right tools that support each stage helps turn conversations into sign-ups or sales down the line.
How do you interpret a voice agent’s connection rate?
The connection rate is the percentage of calls that reached a real person.
In high-volume outbound calling campaigns, it’s usually low because most attempts go to voicemail, are not answered, or result in a busy signal. A low connection rate in this model does not mean failure.
The reason lies in the very design of the operation. When the goal is to cover a large customer base, the agent makes many attempts, knowing that only a fraction will be answered at that moment.
What matters, then, is not the conversion rate in isolation, but rather two things: the absolute number of connections and what happens during those calls.
Imagine a campaign that sends out 1,000 attempts and generates 50 connections. That’s a 5% success rate, but it represents 50 real conversations that could turn into scheduled appointments.
The connection rate is a red flag in two cases. The first is when the absolute number of connections is too low for your goal, even with high volume.
The second is when the rate drops sharply compared to your own historical data, which may indicate an outdated list, incorrect numbers, or a poor send time.
Instead of comparing it to a generic market figure, compare the campaign to its own performance over time.
What do the sentiment and reason for ending the call reveal?
Sentiment and reason for ending the call are metrics of conversation quality. Sentiment classifies how the lead reacted—positively, neutrally, or negatively—based on tone and the words used.
The reason for ending, on the other hand, explains why each call ended, distinguishing between natural endings and cases of being blocked, rejected, or routed to voicemail or an automated menu.
Sentiment acts as a barometer for the approach. A high proportion of positive responses combined with few negative ones tends to indicate that the script, the offer, and the timing are well-calibrated for that audience.
A sudden spike in negative reactions is a sign that you should review what’s being said, to whom, and at what time. Since the classification is automatic—performed by AI based on language—it’s best to observe the trend over time rather than reacting to a single conversation.
The reason for the termination helps explain what’s limiting reach. A high volume of calls ended by the user is to be expected in real conversations.
On the other hand, a high rate of rejected or blocked calls may indicate that the number has been marked as spam, comes from a low-quality database, or is actively blocked, and warrants attention both for efficiency and for the reputation of the number being used.
How do you measure the AI SDR agent on WhatsApp?
On WhatsApp, the metrics take a different form but follow the same logic of effort, reach, and quality. Instead of voice connections, what matters is whether the message was delivered, whether it was read, whether it generated a response, and how long it took until the first interaction.
A conversation that progresses to qualification is the equivalent, on this channel, of an actual phone call.
The metrics begin with sending. Messages sent and delivered reflect the effort and technical health of the contact list, since delivery depends on a valid number and the sender’s good reputation.
The open rate and, above all, the response rate are key indicators, as they reveal whether the approach is resonating with the recipients.
In turn, the time to response indicates the pace of the conversation, and conversations that lead to a scheduled appointment or a lead qualification show the actual results.
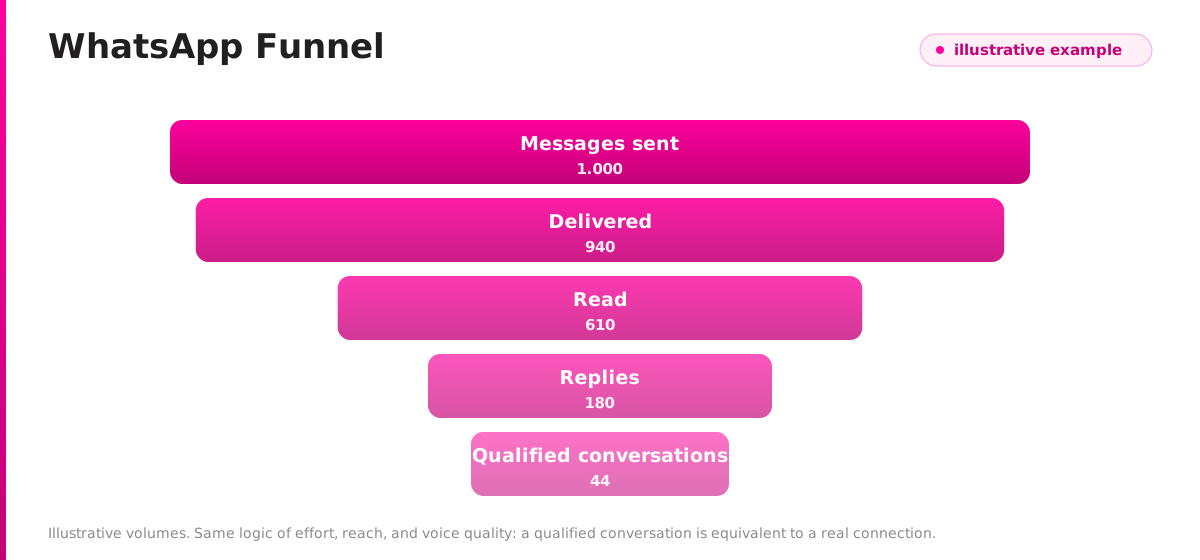 Image 02: WhatsApp Funnel: each stage filters the volume down to the qualified conversation, which is equivalent to an actual voice call. Illustrative volumes.
There is also a metric that requires careful attention: unsubscriptions and blocks. High rates generally point to a list lacking proper consent or to an invasive approach, which hinders future delivery and has implications for compliance with the General Data Protection Law (LGPD).
The LGPD requires a legal basis for data processing in communications, whether it be consent or legitimate interest recognized by the ANPD.
Comparing voice calls and WhatsApp side by side also helps, because the same lead might ignore a call and respond quickly via message—or vice versa.
What is the best day and time for an SDR agent to call?
The best time for the agent to call is midweek, in the late morning and late afternoon, during business hours.
Two charts on the dashboard can help you find the right time: activity by day of the week and peak times.
The first shows how call volume is distributed throughout the week; the second shows the times of day when people are actually available to answer. Together, they indicate when to focus your efforts and when to scale back.
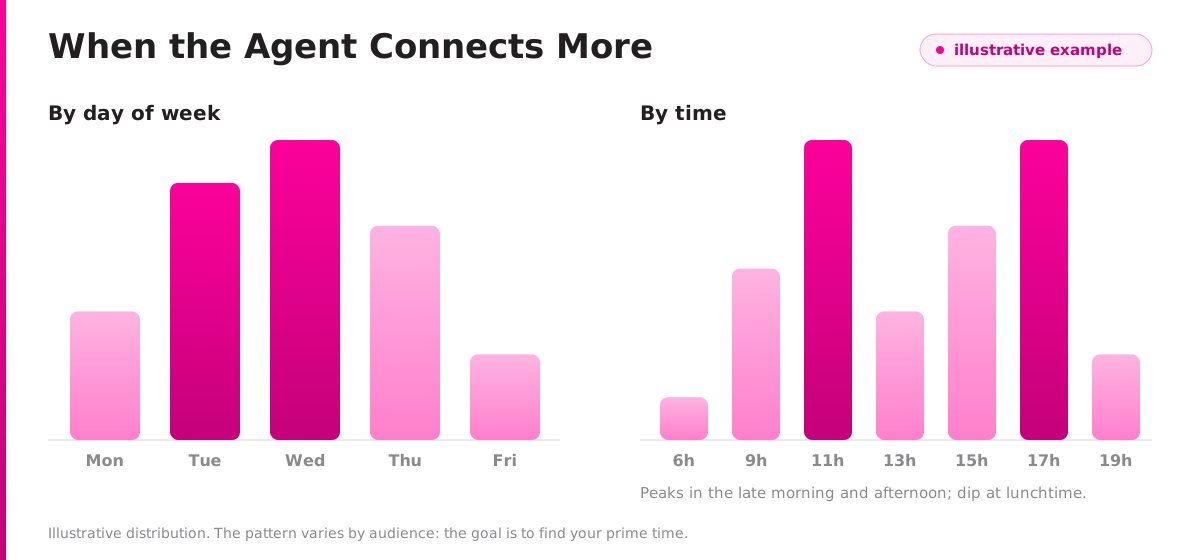 Image 03: When agents connect the most: midweek and the late-morning and late-afternoon peaks account for the majority of connections. This is an illustrative distribution; the pattern varies by location.
A HubSpot analysis of the best times to make calls points to Tuesday as the best day and Friday as the worst, with a drop in call volume during lunchtime, in the early morning, and at the start of the day. Large-scale surveys, with over one million calls analyzed, confirm that the middle of the week is the most productive time.
This pattern, however, varies by audience, and that’s exactly what the timing chart reveals: your prime time, not a pattern copied from elsewhere. The goal is to identify the time slots when your customer base is available and set aside that time for your agents.
The distribution by day poses an operational risk that is often overlooked. Concentrating nearly all the volume on a single day of the week may seem efficient, but it leaves the campaign vulnerable; if that day falls on a holiday or is atypical, the entire result for the period is compromised.
Spreading out attempts throughout the week reduces this risk and prevents overwhelming the customer base. Also, respect appropriate contact times—both as a matter of common sense and as a standard practice—by avoiding calls that are too early or too late.
How should you interpret the connection rate by day and by hour?
The daily and hourly connection rates show the proportion of attempts that resulted in conversations during each time period.
They’re useful for identifying effective time slots, but they can be misleading when the volume is low. An hour with a 100% connection rate might simply mean that a single call was made—and it was answered.
This is the most dangerous blind spot in a prospecting dashboard. Time periods with very few attempts produce spectacular or disastrous rates that say nothing about actual behavior.
Therefore, before drawing any conclusions from a specific day or time slot, require a minimum volume—in the range of tens of attempts—and always cross-reference the rate with the absolute number of calls in that segment. The window of interest is the one that combines both significant volume and a good rate at the same time.
Reading a dashboard of this type with a critical eye requires the same discipline demanded by other AI-generated data reports: the number alone isn’t enough; it’s the context that defines what it means. A high metric based on a tiny sample is noise, not insight.
How can you turn the SDR’s dashboard into decisions?
A dashboard is only as valuable as the decisions it drives. Tracking AI-powered SDR agent metrics without acting on them is reporting, not management.
The value emerges when each indicator becomes a hypothesis for improvement: adjusting the list, the script, the schedule, the tone of the approach, and the timing for handing the lead off to a human salesperson.
Each metric points to a lever for improvement. Low connection rates call for a review of the lead pool, the numbers being targeted, and the outreach schedule. A rise in negative sentiment calls for a review of the script and segmentation. High unsubscription rates on WhatsApp call for attention to consent and message frequency.
And the sign that a lead has become hot—indicated by the duration and sentiment of the conversation—is the trigger for the handoff, which is the point at which the agent hands the opportunity over to a person who will manage the relationship and close the deal.
This cycle is only complete when the dashboard syncs with the CRM. That’s where the opportunity progresses and where the final result—the scheduled meeting, enrollment, or sale—is linked back to the contact that originated it.
Keeping agents, data, and automations integrated is what sustains the cycle—something that tools like the HubSpot Agent CLI help put into practice.
Drawing reliable conclusions from these numbers and linking them to goals is the work of data science applied to lead generation, which transforms the dashboard into a tool for continuous improvement rather than just a pretty screen that no one uses.
Frequently Asked Questions About AI SDR Agent Metrics
How can you tell if the AI SDR agent is delivering results?
For a prospecting agent, success isn’t measured by the volume of calls or the number of messages sent. It’s the combination of genuine connections, well-received conversations, and leads that move forward to the sales team—as tracked on a dashboard that analyzes effort, reach, and quality and integrates with the CRM.
An agent who makes a lot of calls but engages in few conversations is busy, not productive—and only the right metrics reveal this difference.
Structuring this tracking, distinguishing between actual connections and mere attempts, analyzing sentiment and the reason for call termination, identifying the best times to call, avoiding the pitfalls of small sample sizes, and linking everything to the CRM—that’s what distinguishes a mere decorative dashboard from a true management tool.
This is the kind of monitoring that mkt4edu builds and operates for prospecting agents, fine-tuning operations based on what the data reveals, week after week.
If your institution already uses or is considering using an AI-powered SDR and wants to truly see what it delivers, talk to the mkt4edu team to set up the dashboard and the improvement cycle behind it. Accurate measurement is the first step toward selling more with artificial intelligence.
Now that you know how to interpret performance metrics, the next natural step is to evaluate the financial viability and ROI of this operation.
Find out how much it costs to deploy an AI agent in your sales operations and understand the relationship between implementation and maintenance costs and the savings generated at scale.



.jpg)
























 Portugal